- Matplotlib Basics
- Matplotlib - Home
- Matplotlib - Introduction
- Matplotlib - Vs Seaborn
- Matplotlib - Environment Setup
- Matplotlib - Anaconda distribution
- Matplotlib - Jupyter Notebook
- Matplotlib - Pyplot API
- Matplotlib - Simple Plot
- Matplotlib - Saving Figures
- Matplotlib - Markers
- Matplotlib - Figures
- Matplotlib - Styles
- Matplotlib - Legends
- Matplotlib - Colors
- Matplotlib - Colormaps
- Matplotlib - Colormap Normalization
- Matplotlib - Choosing Colormaps
- Matplotlib - Colorbars
- Matplotlib - Working With Text
- Matplotlib - Text properties
- Matplotlib - Subplot Titles
- Matplotlib - Images
- Matplotlib - Image Masking
- Matplotlib - Annotations
- Matplotlib - Arrows
- Matplotlib - Fonts
- Matplotlib - Font Indexing
- Matplotlib - Font Properties
- Matplotlib - Scales
- Matplotlib - LaTeX
- Matplotlib - LaTeX Text Formatting in Annotations
- Matplotlib - PostScript
- Matplotlib - Mathematical Expressions
- Matplotlib - Animations
- Matplotlib - Celluloid Library
- Matplotlib - Blitting
- Matplotlib - Toolkits
- Matplotlib - Artists
- Matplotlib - Styling with Cycler
- Matplotlib - Paths
- Matplotlib - Path Effects
- Matplotlib - Transforms
- Matplotlib - Ticks and Tick Labels
- Matplotlib - Radian Ticks
- Matplotlib - Dateticks
- Matplotlib - Tick Formatters
- Matplotlib - Tick Locators
- Matplotlib - Basic Units
- Matplotlib - Autoscaling
- Matplotlib - Reverse Axes
- Matplotlib - Logarithmic Axes
- Matplotlib - Symlog
- Matplotlib - Unit Handling
- Matplotlib - Ellipse with Units
- Matplotlib - Spines
- Matplotlib - Axis Ranges
- Matplotlib - Axis Scales
- Matplotlib - Axis Ticks
- Matplotlib - Formatting Axes
- Matplotlib - Axes Class
- Matplotlib - Twin Axes
- Matplotlib - Figure Class
- Matplotlib - Multiplots
- Matplotlib - Grids
- Matplotlib - Object-oriented Interface
- Matplotlib - PyLab module
- Matplotlib - Subplots() Function
- Matplotlib - Subplot2grid() Function
- Matplotlib - Anchored Artists
- Matplotlib - Manual Contour
- Matplotlib - Coords Report
- Matplotlib - AGG filter
- Matplotlib - Ribbon Box
- Matplotlib - Fill Spiral
- Matplotlib - Findobj Demo
- Matplotlib - Hyperlinks
- Matplotlib - Image Thumbnail
- Matplotlib - Plotting with Keywords
- Matplotlib - Create Logo
- Matplotlib - Multipage PDF
- Matplotlib - Multiprocessing
- Matplotlib - Print Stdout
- Matplotlib - Compound Path
- Matplotlib - Sankey Class
- Matplotlib - MRI with EEG
- Matplotlib - Stylesheets
- Matplotlib - Background Colors
- Matplotlib - Basemap
- Matplotlib Event Handling
- Matplotlib - Event Handling
- Matplotlib - Close Event
- Matplotlib - Mouse Move
- Matplotlib - Click Events
- Matplotlib - Scroll Event
- Matplotlib - Keypress Event
- Matplotlib - Pick Event
- Matplotlib - Looking Glass
- Matplotlib - Path Editor
- Matplotlib - Poly Editor
- Matplotlib - Timers
- Matplotlib - Viewlims
- Matplotlib - Zoom Window
- Matplotlib Widgets
- Matplotlib - Cursor Widget
- Matplotlib - Annotated Cursor
- Matplotlib - Buttons Widget
- Matplotlib - Check Buttons
- Matplotlib - Lasso Selector
- Matplotlib - Menu Widget
- Matplotlib - Mouse Cursor
- Matplotlib - Multicursor
- Matplotlib - Polygon Selector
- Matplotlib - Radio Buttons
- Matplotlib - RangeSlider
- Matplotlib - Rectangle Selector
- Matplotlib - Ellipse Selector
- Matplotlib - Slider Widget
- Matplotlib - Span Selector
- Matplotlib - Textbox
- Matplotlib Plotting
- Matplotlib - Line Plots
- Matplotlib - Area Plots
- Matplotlib - Bar Graphs
- Matplotlib - Histogram
- Matplotlib - Pie Chart
- Matplotlib - Scatter Plot
- Matplotlib - Box Plot
- Matplotlib - Arrow Demo
- Matplotlib - Fancy Boxes
- Matplotlib - Zorder Demo
- Matplotlib - Hatch Demo
- Matplotlib - Mmh Donuts
- Matplotlib - Ellipse Demo
- Matplotlib - Bezier Curve
- Matplotlib - Bubble Plots
- Matplotlib - Stacked Plots
- Matplotlib - Table Charts
- Matplotlib - Polar Charts
- Matplotlib - Hexagonal bin Plots
- Matplotlib - Violin Plot
- Matplotlib - Event Plot
- Matplotlib - Heatmap
- Matplotlib - Stairs Plots
- Matplotlib - Errorbar
- Matplotlib - Hinton Diagram
- Matplotlib - Contour Plot
- Matplotlib - Wireframe Plots
- Matplotlib - Surface Plots
- Matplotlib - Triangulations
- Matplotlib - Stream plot
- Matplotlib - Ishikawa Diagram
- Matplotlib - 3D Plotting
- Matplotlib - 3D Lines
- Matplotlib - 3D Scatter Plots
- Matplotlib - 3D Contour Plot
- Matplotlib - 3D Bar Plots
- Matplotlib - 3D Wireframe Plot
- Matplotlib - 3D Surface Plot
- Matplotlib - 3D Vignettes
- Matplotlib - 3D Volumes
- Matplotlib - 3D Voxels
- Matplotlib - Time Plots and Signals
- Matplotlib - Filled Plots
- Matplotlib - Step Plots
- Matplotlib - XKCD Style
- Matplotlib - Quiver Plot
- Matplotlib - Stem Plots
- Matplotlib - Visualizing Vectors
- Matplotlib - Audio Visualization
- Matplotlib - Audio Processing
- Matplotlib Useful Resources
- Matplotlib - Quick Guide
- Matplotlib - Cheatsheet
- Matplotlib - Useful Resources
- Matplotlib - Discussion
Matplotlib - Hinton Diagram
A Hinton diagram, also known as a "matrix diagram," is a way to represent data in a matrix (grid) format using colored squares. Each square in the matrix corresponds to a specific data point, and the intensity of the color represents the magnitude of that value.
Imagine that you are managing a small team consisting of members A, B, C, and D. Your aim is to represent the skill levels of each team member on a scale from 1 to 10 in three different areas: Programming, Design, and Communication. As you fill in the matrix, the darkness of each square will reflect the skill level of corresponding team member. Darker squares indicates higher skill levels, while lighter squares indicate areas where team members may have lower skills relative to others −
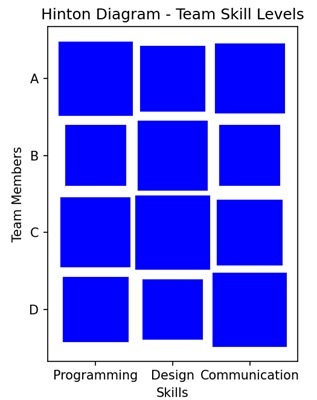
Hinton Diagram in Matplotlib
We can create hinton diagrams in Matplotlib using the hinton() function. This function automatically adjusts the appearance of the diagram to provide a clear visualization of the matrix structure.
The hinton() Function
The hinton() function is not a built-in function in Matplotlib. However, you can create a custom function for generating Hinton diagrams. It takes a matrix as input, where the size of each square corresponds to the magnitude of the matrix element, and the shading indicates the sign (positive or negative).
Let us start by drawing a random matrix hinton diagram.
Random Matrix Hinton Diagram
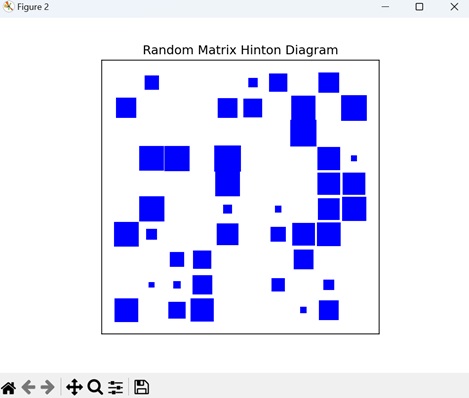
In the random matrix Hinton diagram each square corresponds to an element in the matrix, and its size indicates the magnitude of the corresponding value. Larger squares represent larger magnitudes. The shading of the squares distinguishes between positive and negative values, with different intensities used for each.
Example
In the following example, we first defining a function "hinton" to create a Hinton diagram, which represents a matrix with colored rectangles in a plot. We gnerate a random 10x10 matrix with values between -1 and 1 −
import matplotlib.pyplot as plt
import numpy as np

def hinton(matrix, max_value=None, ax=None):
   # Function to create Hinton diagram
   if ax is None:
      fig, ax = plt.subplots()

   if max_value is None:
      max_value = matrix.max()

   # Setting up the plot
   ax.set_aspect('equal', 'box')
   ax.xaxis.set_major_locator(plt.NullLocator())
   ax.yaxis.set_major_locator(plt.NullLocator())

   # Iterating over matrix elements and creating rectangles
   for (i, j), val in np.ndenumerate(matrix):
      color = 'blue'
      size = np.sqrt(val / max_value)
      rect = plt.Rectangle([j - size / 2, i - size / 2], size, size,
         facecolor=color, edgecolor=color)
      ax.add_patch(rect)

   # Adjusting plot settings
   ax.autoscale_view()
   ax.invert_yaxis()

# Creating a random matrix
matrix_data = np.random.rand(10, 10) * 2 - 1

# Plotting the Hinton diagram
plt.figure(figsize=(8, 8))
hinton(matrix_data)
plt.title('Random Matrix Hinton Diagram')
plt.show()
Output
After executing the above code, we get the following output −
Identity Matrix Hinton Diagram
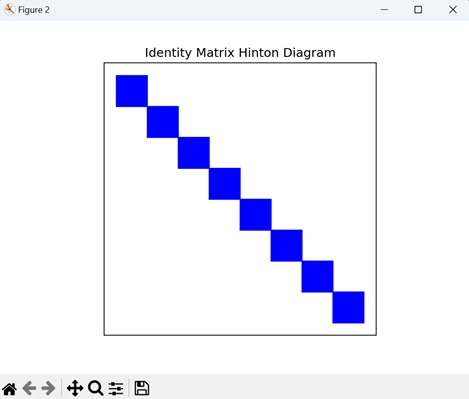
In the context of a Hinton diagram for an identity matrix, an identity matrix is a square matrix in which all the elements of the principal diagonal are ones, and all other elements are zeros. The Hinton diagram for an identity matrix will have a distinct pattern where only the diagonal elements are filled, representing their value, and the non-diagonal elements are empty.
Example
In here, creating a Hinton diagram for an 8x8 identity matrix. First, we define a function called "hinton" to generate the diagram. We set up the plot and iterate over the elements of the matrix, creating rectangles to represent the magnitude of each element. The identity matrix is generated using the NumPy library. The Hinton diagram is then plotted, with dark blue rectangles along the diagonal to reflect the non-zero values of the identity matrix −
import numpy as np
import matplotlib.pyplot as plt

def hinton(matrix, max_value=None, ax=None):
   # Function to create Hinton diagram
   if ax is None:
      fig, ax = plt.subplots()

   if max_value is None:
      max_value = matrix.max()

   # Setting up the plot
   ax.set_aspect('equal', 'box')
   ax.xaxis.set_major_locator(plt.NullLocator())
   ax.yaxis.set_major_locator(plt.NullLocator())

   # Iterating over matrix elements and creating rectangles
   for (i, j), val in np.ndenumerate(matrix):
      color = 'blue'
      size = np.sqrt(val / max_value)
      rect = plt.Rectangle([j - size / 2, i - size / 2], size, size,
         facecolor=color, edgecolor=color)
      ax.add_patch(rect)

   # Adjusting plot settings
   ax.autoscale_view()
   ax.invert_yaxis()

# Creating an 8x8 identity matrix
matrix_data = np.eye(8)

# Plotting the Hinton Diagram for the identity matrix
plt.figure(figsize=(8, 8))
hinton(matrix_data)
plt.title('Identity Matrix Hinton Diagram')
plt.show()
Output
Following is the output of the above code −
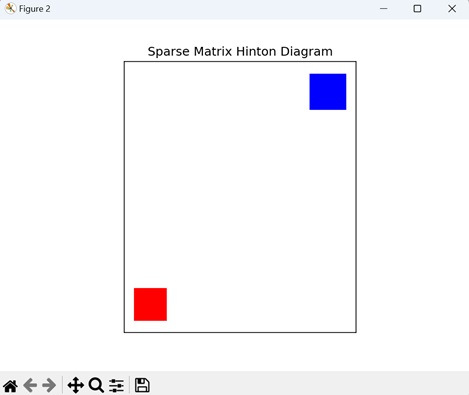
Sparse Matrix Hinton Diagram
A sparse matrix Hinton diagram in Matplotlib is a visual representation of a sparse matrix where non-zero elements are represented by squares with varying sizes and colors. This visualization effectively highlights the sparse pattern of the matrix.
Example
Now, we are creating sparse 12x12 matrix using NumPy, where most of the elements are set to zero. We are assigning non-zero values to two positions in the matrix: (3, 7) with a value of 1.5, and (9, 2) with a value of -1.2. We then use the hinton() function to generate a Hinton diagram for this sparse matrix. In the diagram, positive values are shown in blue, while negative values are shown in red −
import numpy as np
import matplotlib.pyplot as plt

def hinton(matrix, max_value=None, ax=None):

   if ax is None:
      fig, ax = plt.subplots()

   # Setting the maximum value for scaling
   if max_value is None:
      max_value = np.max(np.abs(matrix))

   # Setting up the plot
   ax.set_aspect('equal', 'box')
   ax.xaxis.set_major_locator(plt.NullLocator())
   ax.yaxis.set_major_locator(plt.NullLocator())

   # Iterating over matrix elements
   for (i, j), val in np.ndenumerate(matrix):
      # Determining color based on the sign of the value
      color = 'blue' if val >= 0 else 'red'
      # Scaling the size of rectangles based on the absolute value of the matrix element
      size = np.sqrt(np.abs(val) / max_value)
      # Creating a rectangle and adding it to the plot
      rect = plt.Rectangle([j - size / 2, i - size / 2], size, size,
          facecolor=color, edgecolor=color)
      ax.add_patch(rect)

   # Adjusting plot settings
   ax.autoscale_view()
   ax.invert_yaxis()

# Creating a sparse matrix with non-zero values at specific positions
matrix_data = np.zeros((12, 12))
matrix_data[3, 7] = 1.5
matrix_data[9, 2] = -1.2

# Plotting the Hinton Diagram for the sparse matrix
plt.figure(figsize=(8, 8))
hinton(matrix_data)
plt.title('Sparse Matrix Hinton Diagram')
plt.show()
Output
Output of the above code is as follows −
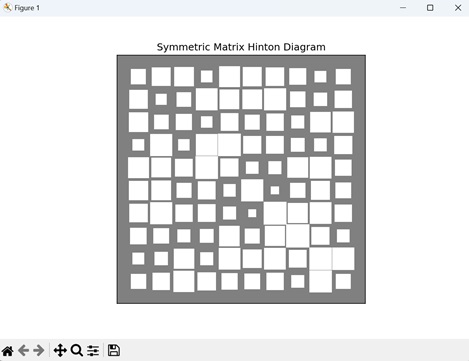
Symmetric Matrix Hinton Diagram
A Hinton diagram for a symmetric matrix specifically highlights its symmetry by displaying only the values in one half of the matrix and mirroring them in the other half. The values above and below the diagonal are shown as mirror images of each other.
Example
In the given example, we generate a Hinton diagram for a symmetric matrix. We begin by creating a random 10x10 matrix To ensure symmetry, we average this matrix with its transpose. We then plot the Hinton diagram using "white" and "black" rectangles to represent "positive" and "negative" values, respectively −
import matplotlib.pyplot as plt
import numpy as np

def hinton(matrix, max_weight=None, ax=None):
   ax = ax if ax is not None else plt.gca()

   if not max_weight:
      max_weight = 2 ** np.ceil(np.log(np.abs(matrix).max()) / np.log(2))

   ax.patch.set_facecolor('gray')
   ax.set_aspect('equal', 'box')
   ax.xaxis.set_major_locator(plt.NullLocator())
   ax.yaxis.set_major_locator(plt.NullLocator())

   for (x, y), w in np.ndenumerate(matrix):
      color = 'white' if w > 0 else 'black'
      size = np.sqrt(np.abs(w) / max_weight)
      rect = plt.Rectangle([x - size / 2, y - size / 2], size, size,
         facecolor=color, edgecolor=color)
      ax.add_patch(rect)

   ax.autoscale_view()
   ax.invert_yaxis()

# Generating a random 10x10 matrix and creating a symmetric matrix
matrix_data = np.random.rand(10, 10)
symmetric_matrix = (matrix_data + matrix_data.T) / 2

# Plotting the Hinton Diagram for the symmetric matrix
plt.figure(figsize=(8, 8))
hinton(symmetric_matrix)
plt.title('Symmetric Matrix Hinton Diagram')
plt.show()
Output
The output obtained is as shown below −
