Monitoring CloudStack and components
- 1. Monitoring CloudStack and Components August, 22nd 2017 Alexander Stock Cloud Infrastructure Architect ©2017itelligenceclassification:public|version:1.105/17/2017
- 2. About Me 2 Sysadmin @BIT.Group GmbH – member of itelligence group Experience in Vmware, KVM, Nagios and Ansible Working with CloudStack since 2015 GitHub: https://github.com/AlexanderStock Mail: alexander.stock@bitgroup.de ©2017itelligenceclassification:public5/17/2017 CloudStack Berlin & Dresden, Germany https://www.meetup.com/german-CloudStack-user-group Ansible Dresden, Germany https://www.meetup.com/Ansible-Dresden
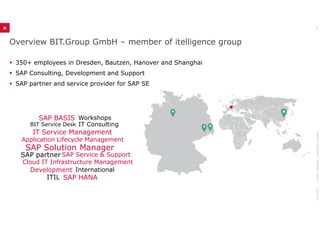
- 3. Overview BIT.Group GmbH – member of itelligence group 3 350+ employees in Dresden, Bautzen, Hanover and Shanghai SAP Consulting, Development and Support SAP partner and service provider for SAP SE ©2017itelligenceclassification:external IT Consulting Development Cloud IT Infrastructure Management SAP BASIS SAP Solution Manager Application Lifecycle Management International BIT Service Desk SAP Service & Support ITIL SAP HANA Workshops IT Service Management SAP partner 5/17/2017
- 4. Since June 2016 BIT.Group GmbH officially part of itelligence and NTT DATA Group Know-how, flexibility and internationality as part of NTT DATA network BIT.Group GmbH as part of itelligence / NTT DATA Group 4 Together internationally leading full IT service provider with: ©2017itelligenceclassification:external 3.500+ active SAP customers Locations in 40+ countries $1,5 billion in SAP revenue worldwide Over 9.000 SAP experts worldwide 5/17/2017
- 5. Agenda 1. What do we use for monitoring? 2. MySQL 3. Tomcat 4. CloudStack API 5. Distributed Monitoring 5 5. Distributed Monitoring ©2017itelligenceclassification:public5/17/2017
- 6. What do we use for Monitoring? 6 Why do we monitor CloudStack? Detecting performance issues Detecting misconfigurations Detecting resource bottlenecks Get a long-term overview of our installationsGet a long-term overview of our installations ©2017itelligenceclassification:public5/17/2017
- 7. What do we use for Monitoring? We use Nagios with frontend called Check_MK Check_MK : Combines passive and active checks Auto inventory of Client hosts Manage host/services/reports 7 Manage host/services/reports Live status: Module to access to the core data of Nagios Can monitor Linux/Unix/Windows/Switches/Storage… Out of the Box S: https://en.wikipedia.org/wiki/File:Cmk-dashboard.png ©2017itelligenceclassification:public5/17/2017
- 8. Event- Konsole Status GUI BI WATO Mobile Custom Applications Multisite Web Platform NagVis Event- Daemon PNP- 4Nagios RRDTool Monitoring Core (Nagios / Icinga) Live status What do we use for Monitoring? Syslog SNMP Traps Linux Solaris VMS Windows HP- UX AIX Switch Sensor Appliance Router PING DNS- Server HTTP- Server TCP- Port Daemon CMK Notify Monitoring Core (Nagios / Icinga) Check_MK Live check Nagios- Plugin Nagios- Plugin TCP or SSH TCP/IP SNMP InlineICMP
- 9. What do we use for Monitoring? 9 Check_MK Host 1 2 34 AgentTCP Active check Passive checks Retrieve data 22.08.2017©2016itelligenceKlassifizierung:intern Nagios core triggers active check (Check_MK script) Check_MK script polls data from client over TCP Check_MK script writes long-term data to RRD files Check_MK script distributes check results to passive checks RRD 34 current state
- 10. MySQL 10 Check_MK Plugin for MySQL Installation Configuration Monitoring-Client wget https://<mycheckmkserver>/check_mk/agents/mk_mysql mv mk_mysql /usr/lib/check_mk_agent/plugin/ Configuration Monitoring-Client Configuration Monitoring-Server ©2017itelligenceclassification:public5/17/2017 vi /etc/check_mk/mysql.cfg [client] user=monitor password=MyPassWord cmk -I <mydbhost> cmk -r
- 11. MySQL 11 Checks: MySQL DB Size <database> MySQL Connections mysql MySQL DB Slave mysql MySQL InnoDB IO mysql MySQL Version mysql Alternatives for pure Nagios: Check mysql health Active Check for MySQL Advanced features like “cache hit rates“ or “slow queries“ ©2017itelligenceclassification:public5/17/2017
- 12. Tomcat 12 Check_MK_Plugin for Tomcat using Jolokia (JMK Bridge): Installation wget http://search.maven.org/remotecontent?filepath=org/jolokia/jolokia- war/1.3.5/jolokia-war-1.3.5.war mv jolokia-war-1.3.5.war /usr/share/cloudstack-management/webapps/jolokia.war service cloudstack-management restart Configuration Monitoring-Client Configuration Monitoring-Server ©2017itelligenceclassification:public5/17/2017 cd /etc/check_mk/ Wget https://<mycheckmkserver>/itlinfra/check_mk/agents/cfg_examples/jolokia.cfg cmk -I <mytomcathost> cmk -r service cloudstack-management restart wget https://<mycheckmkserver>/check_mk/agents/mk_jolokia mv mk_jolokia /usr/lib/check_mk_agent/plugin/
- 13. Tomcat 13 Metrics: JVM <PORT> <url> Requests JVM <PORT> <url> Sessions JVM <PORT> GC PS_MarkSweep JVM <PORT> GC PS_Scavenge JVM <PORT> Memory JVM <PORT> ThreadPool http-8080 JVM <PORT> ThreadPool jk-20400JVM <PORT> ThreadPool jk-20400 JVM <PORT> Threads JVM <PORT> Uptime ©2017itelligenceclassification:public5/17/2017
- 14. CloudStack API 14 Check Cloudstack.py: Developed by BIT.Group to see what's going on inside CloudStack Python script which can monitor different parts of CloudStack Build as an active check which can also be used with plain Nagios Thresholds can be defined in a JSON file (Global thresholds and instance thresholds) Performance Data (long-term usage) will be produced by the ScriptsPerformance Data (long-term usage) will be produced by the Scripts Two categories: Availability checks Resource checks ©2017itelligenceclassification:public5/17/2017
- 15. CloudStack API 15 Availabilty checks: Hoststatus: Status of Hosts per cluster Detects if Hosts are reachable and enabled Writes performance data System VM: Status for Cluster: kvm01 Host Result Status Enabled hv05 OK running yes hv03 OK running yes hv02 OK running yes hv04 OK running yes hv01 OK running yes System VM: Global status of all virtual routers Writes performance data Virtual router: Global status of all virtual routers Detects if VR is up or needs an update Checks Redundant Routers Writes performance data Name Status Running v-1405-VM OK yes s-1406-VM OK yes Name Status Running Upgrade r-1289-VM OK yes no r-1385-VM OK yes no r-1272-VM Critical yes yes r-1173-VM OK yes no r-1381-VM OK yes no Status of redundant VPC Routers Name Status Status ©2017itelligenceclassification:public5/17/2017
- 16. CloudStack API 16 Resource checks: Capacity: • Status of all global capacity metrics • Thresholds can be set in JSON file • Writes performance data for each metric Domains/Projects: OK: CAPACITY_TYPE_CPU is in status ok. Value:37.2% OK: CAPACITY_TYPE_MEMORY is in status ok. Value:71.11% OK: CAPACITY_TYPE_STORAGE_ALLOCATED No Thresholds given.Value:26.99% OK: CAPACITY_TYPE_VIRTUAL_NETWORK_PUBLIC_IP No Thresholds given. Value:63.03% OK: CAPACITY_TYPE_PRIVATE_IP No Thresholds given. Value:3.92% OK: CAPACITY_TYPE_VLAN No Thresholds given. Value:92.96% OK: CAPACITY_TYPE_DIRECT_ATTACHED_PUBLIC_IP No Thresholds given. Value:2.01% OK: CAPACITY_TYPE_SECONDARY_STORAGE No Thresholds given. Value:45.01% OK: CAPACITY_TYPE_STORAGE No Thresholds given. Value:19.38% OK: CAPACITY_TYPE_LOCAL_STORAGE No Thresholds given. Value:0% Domains/Projects: • Monitors usage metrics for all domains/projects • Checks if domains/projects have • reached their resource thresholds • Thresholds can be set in JSON file • Writes performance data for all metrics Offerings: • Monitors if offerings can be deployed on clusters • Thresholds can be defined in JSON file • Writes performance data for each offering Results for Domain ROOT: Results for Domain DOM1: Warning: Domain DOM1 has reached threshold for cpu: 80 Results for Domain DOM2: Results for Domain DOM3: Results for Domain DOM4: Warning: Domain DOM4 has reached threshold for memory: 80 Results for Domain DOM5: Statistics for Cluster: kvm01 ! Offering ! Count! !XL ! 21! !XXL ! 12! !XXXL ! 5! !XXXXL ! 0! !XXXXXL ! 0! --> Critical: Offering: XXXXL can not be deployed anymore --> Critical: Offering: XXXXXL can not be deployed anymore ©2017itelligenceclassification:public5/17/2017
- 17. CloudStack API 17 Execution: Configfiles: For domain and project checks: For offering and capacity checks: { "thresholds": { { "thresholds": { ./cloudstack-resources.py -m <MODE> -f <configfile> -d <optional DomainID> -p <optional ProjectID> "thresholds": { „DOM1": { "cpu": { "warn": "50", "critical": "90" } } }, "global":{ "cpu": { "warn": „60", "critical": "95" } } } "thresholds": { "CAPACITY_TYPE_MEMORY": { "warn": "50", "critical": "80" }, "CAPACITY_TYPE_CPU": { "warn": "30", "critical": „70" } } } ©2017itelligenceclassification:public5/17/2017
- 18. CloudStack API 18 Outlook: Checks to come: Monitoring of usage of networks Monitoring optimal VM placement Resource forecasting Monitoring old snapshots Download: https://exchange.nagios.org/directory/Plugins/Cloud/Check_Cloudstack/details ©2017itelligenceclassification:public5/17/2017
- 19. Distributed Monitoring 19 One Master Server which holds all configurations of the slaves Status of objects will be queried on demand via Live status All data is stored on the slaves Core State System System System RRDs Livestatus Master Site All data is stored on the slaves Configurations of the slaves will be done via API and HTTPS Slaves provide UI functionality for the customers Setup can be done over UI ©2017itelligenceclassification:public5/17/2017 Core State System System System RRDs Core State System System System RRDs Slave Site 2Slave Site 1 Livestatus Livestatus
- 20. Distributed Monitoring 20 Configuration of hosts and setting over UI or API. Automation with Chef, Ansible… Central overview of all systems Rules can maintained centraly Monitoring Network (isolated) ©2017itelligenceclassification:public5/17/2017 NetworkCustomerA(isolated) NetworkCustomerB(isolated) UI Access User Replication of setting and Query of Livestatus Check of Servers
- 21. Summary 21 Detecting performance issues Solved through MySQL and Tomcat checks Detecting misconfigurations: Solved through availability checks through the API Detecting resource bottlenecks: Solved through resource checks through the API Get a long-term overview of our installations: All checks producing RRD Files which can be used for analysis over a long period ©2017itelligenceclassification:public5/17/2017
- 23. classification:public|author:AlexanderStock|version:1.1 Questions? Alexander Stock Cloud Infrastructure Architect alexander.stock@bitgroup.de BIT.Group GmbH – member of itelligence group We make the most of SAP® solutions! 5/17/2017©2017itelligenceclassification:public|author:AlexanderStock|version:1.1 Contact Questions?`
- 24. No part of this publication may be reproduced or transmitted in any form or for any purpose without the express permission of itelligence AG. The information contained herein may be changed without prior notice. Some software products marketed by itelligence AG and its distributors contain proprietary software components of other software vendors. All product and service names mentioned and associated logos displayed are the trademarks of their respective companies. Data contained in this document serves informational purposes only. National product specifications may vary. Copyright itelligence AG - All rights reserved 8/22/2017©2017itelligence trademarks of their respective companies. Data contained in this document serves informational purposes only. National product specifications may vary. The information in this document is proprietary to itelligence. This document is a preliminary version and not subject to your license agreement or any other agreement with itelligence. This document contains only intended strategies, developments and product functionalities and is not intended to be binding upon itelligence to any particular course of business, product strategy, and/or development. itelligence assumes no responsibility for errors or omissions in this document. itelligence does not warrant the accuracy or completeness of the information, text, graphics, links, or other items contained within this material. This document is provided without a warranty of any kind, either express or implied, including but not limited to the implied warranties of merchantability, fitness for a particular purpose, or non-infringement. itelligence shall have no liability for damages of any kind including without limitation direct, special, indirect, or consequential damages that may result from the use of these materials. This limitation shall not apply in cases of intent or gross negligence. The statutory liability for personal injury and defective products is not affected. itelligence has no control over the information that you may access through the use of hot links contained in these materials and does not endorse your use of third-party Web pages nor provide any warranty whatsoever relating to third-party Web pages.


![MySQL
10
Check_MK Plugin for MySQL
Installation
Configuration Monitoring-Client
wget https://<mycheckmkserver>/check_mk/agents/mk_mysql
mv mk_mysql /usr/lib/check_mk_agent/plugin/
Configuration Monitoring-Client
Configuration Monitoring-Server
©2017itelligenceclassification:public5/17/2017
vi /etc/check_mk/mysql.cfg
[client]
user=monitor
password=MyPassWord
cmk -I <mydbhost>
cmk -r](https://image.slidesharecdn.com/monitoringcloudstackandcomponents-170822114556/85/Monitoring-CloudStack-and-components-10-320.jpg)


