. 2024 Oct 29;14(11):1376.
doi: 10.3390/biom14111376.

Identifying Hub Genes and Metabolic Pathways in Collagen VI-Related Dystrophies: A Roadmap to Therapeutic Intervention

Affiliations

Identifying Hub Genes and Metabolic Pathways in Collagen VI-Related Dystrophies: A Roadmap to Therapeutic Intervention

Atakan Burak Ceyhan et al. Biomolecules. .

Abstract

Collagen VI-related dystrophies (COL6RD) are a group of rare muscle disorders caused by mutations in specific genes responsible for type VI collagen production. It affects muscles, joints, and connective tissues, leading to weakness, joint problems, and structural issues. Currently, there is no effective treatment for COL6RD; its management typically addresses symptoms and complications. Therefore, it is essential to decipher the disease's molecular mechanisms, identify drug targets, and develop effective treatment strategies to treat COL6RD. In this study, we employed differential gene expression analysis, weighted gene co-expression network analysis, and genome-scale metabolic modeling to investigate gene expression patterns in COL6RD patients, uncovering key genes, significant metabolites, and disease-related pathophysiological pathways. First, we performed differential gene expression and weighted gene co-expression network analyses, which led to the identification of 12 genes (CHCHD10, MRPS24, TRIP10, RNF123, MRPS15, NDUFB4, COX10, FUNDC2, MDH2, RPL3L, NDUFB11, PARVB) as potential hub genes involved in the disease. Second, we utilized a drug repurposing strategy to identify pharmaceutical candidates that could potentially modulate these genes and be effective in the treatment. Next, we utilized context-specific genome-scale metabolic models to compare metabolic variations between healthy individuals and COL6RD patients. Finally, we conducted reporter metabolite analysis to identify reporter metabolites (e.g., phosphatidates, nicotinate ribonucleotide, ubiquinol, ferricytochrome C). In summary, our analysis revealed critical genes and pathways associated with COL6RD and identified potential targets, reporter metabolites, and candidate drugs for therapeutic interventions.

Keywords: collagen VI-related dystrophies; drug repurposing; genome-scale metabolic models; network analysis; systems biology.


Conflict of interest statement

A.M. and H.T. are the founders and shareholders of Trustlife Therapeutics, while the remaining authors report no conflicts of interest.

Figures

Figure 1
Figure 1
A blueprint illustrating a systematic approach for our research. Initially, we analyzed RNA sequencing data from a prior cohort to pinpoint gene targets. This involved conducting differential expression, functional enrichment, and gene co-expression network analysis, then integrating their findings. Subsequently, we employed a pathway-based method for drug repurposing to identify drugs that can activate these genes in COL6RD. Additionally, we developed condition-specific GEMs to highlight metabolic distinctions between COL6RD patients and healthy controls. Finally, we utilized reporter metabolite analysis to propose potential biomarkers for COL6RD.
Figure 2
Figure 2
(A) The distribution of differentially expressed genes is depicted. Genes exhibiting significantly upregulated expressions (FDR < 10−5) are highlighted in red, while those with significantly downregulated expressions (FDR < 10−5) are depicted in blue. Genes with FDR scores exceeding 10−5 are illustrated in black. (B,C) The top 20 enriched pathways of upregulated DEGs are presented in (B), while the top 20 enriched pathways of downregulated DEGs are displayed in (C), based on the p-adjusted score. In this representation, a smaller p-adjusted value is denoted by the color red, while blue indicates a higher value. The size of the dots reflects the number of genes associated with a specific pathway.
Figure 2
Figure 2
(A) The distribution of differentially expressed genes is depicted. Genes exhibiting significantly upregulated expressions (FDR < 10−5) are highlighted in red, while those with significantly downregulated expressions (FDR < 10−5) are depicted in blue. Genes with FDR scores exceeding 10−5 are illustrated in black. (B,C) The top 20 enriched pathways of upregulated DEGs are presented in (B), while the top 20 enriched pathways of downregulated DEGs are displayed in (C), based on the p-adjusted score. In this representation, a smaller p-adjusted value is denoted by the color red, while blue indicates a higher value. The size of the dots reflects the number of genes associated with a specific pathway.
Figure 3
Figure 3
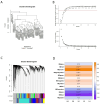
(A) The dendrogram illustrating the hierarchical clustering of the COL6RD cohort’s samples was generated, but two outliers (SRR6015106 and SRR6015079) were excluded. (B) Graphs were created to depict the mean connectivity and fit of the scale-free topology model, with the y-intercept set at 0.8. Based on a high R2 value and reduced mean connectivity, a soft threshold power of 9 was chosen. (C) Profiles of cluster dendrograms and module detection are displayed, with module colors shown before and after merging below the dendrogram. (D) The heatmap shows Pearson correlations between module eigengenes and COL6RD disease state, with positive correlations in brown and negative in purple. Asterisks indicate significance levels: a single asterisk (*) denotes a p-value below 0.05, a double asterisk (**) denotes a p-value below 0.01, and a triple asterisk (***) denotes a p-value below 0.001. Genes that are not part of any module are shown in grey.
Figure 4
Figure 4
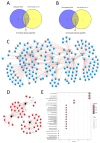
(A,B) We identified 22 genes shared between the top 1% upregulated modules and upregulated DEGs, and 24 genes common to the top 1% downregulated modules and downregulated DEGs. However, only 12 genes that exclusively have specific expression patterns for muscle tissue, based on the Human Protein Atlas database, were selected as targets. (C) Using the iNetModels database, a network graph of coexpression patterns for 10 selected genes was created. Node limits were set to 25 and red lines indicate positive correlations. (D) A coexpression map for COL6A1, COL6A2, and COL6A3 was created using the iNetModels database. Red nodes show upregulated genes in our study, while white nodes are not differentially expressed. Red lines represent positive correlations between nodes. The node limit was set to 25, and the correlation parameter was set to “Both”. (E) Functional enrichment analysis results for the target genes are presented here, which were subsequently utilized in the Gene2drug tool.
Figure 5
Figure 5
(A) A cluster gram displays Hamming distances between COL6RD and healthy GEMs, based on their reaction content and gene expressions. Notably, the Healthy GEM and COL6RD-Common model, generated from the average TPM of all COL6RD patients regardless of their histological grade, exhibit the most distinct pattern compared to others. (B) Another cluster gram highlights variations in subsystem coverage, focusing on those with at least a 25% variance in one or more GEMs. Redder tones signify higher coverage, while bluer tones denote lower coverage compared to other pathways. (C) A scatter plot depicts variations in the success or failure of metabolic tasks within genome-scale models. It is worth noting that genes with expression levels below 1 TPM are considered not expressed in the model while being built with the tINIT algorithm.
Figure 5
Figure 5
(A) A cluster gram displays Hamming distances between COL6RD and healthy GEMs, based on their reaction content and gene expressions. Notably, the Healthy GEM and COL6RD-Common model, generated from the average TPM of all COL6RD patients regardless of their histological grade, exhibit the most distinct pattern compared to others. (B) Another cluster gram highlights variations in subsystem coverage, focusing on those with at least a 25% variance in one or more GEMs. Redder tones signify higher coverage, while bluer tones denote lower coverage compared to other pathways. (C) A scatter plot depicts variations in the success or failure of metabolic tasks within genome-scale models. It is worth noting that genes with expression levels below 1 TPM are considered not expressed in the model while being built with the tINIT algorithm.
Figure 6
Figure 6
(A,B) Dot plots showcase the top ten upregulated and downregulated reporter metabolites, ranked by the lowest p-value. Upregulation is denoted by red dots, while downregulation is represented by blue dots. Each dot’s size corresponds to the metabolite’s Z score, with larger sizes indicating higher Z scores.

Similar articles

References

    1. Muscular Dystrophy. NHS. [(accessed on 3 August 2024)]. Available online: https://www.nhs.uk/conditions/muscular-dystrophy/
    1. Mercuri E., Bönnemann C.G., Muntoni F. Muscular dystrophies. Lancet. 2019;394:2025–2038. doi: 10.1016/S0140-6736(19)32910-1. - DOI - PubMed
    1. Topaloğlu H., Poorshiri B. The congenital muscular dystrophies. Ann. Child Neurol. Soc. 2024;2:27–39. doi: 10.1002/cns3.20050. - DOI
    1. Bönnemann C.G. The collagen VI-related myopathies: Muscle meets its matrix. Nat. Rev. Neurol. 2011;7:379–390. doi: 10.1038/nrneurol.2011.81. - DOI - PMC - PubMed
    1. Di Martino A., Cescon M., D’Agostino C., Schilardi F., Sabatelli P., Merlini L., Faldini C. Collagen VI in the Musculoskeletal System. Int. J. Mol. Sci. 2023;24:5095. doi: 10.3390/ijms24065095. - DOI - PMC - PubMed

MeSH terms

Substances

LinkOut - more resources