. 2024 Apr 22;15(1):3385.
doi: 10.1038/s41467-024-47806-3.

An approach to identify gene-environment interactions and reveal new biological insight in complex traits

Affiliations

An approach to identify gene-environment interactions and reveal new biological insight in complex traits

Xiaofeng Zhu et al. Nat Commun. .

Abstract

There is a long-standing debate about the magnitude of the contribution of gene-environment interactions to phenotypic variations of complex traits owing to the low statistical power and few reported interactions to date. To address this issue, the Gene-Lifestyle Interactions Working Group within the Cohorts for Heart and Aging Research in Genetic Epidemiology Consortium has been spearheading efforts to investigate G × E in large and diverse samples through meta-analysis. Here, we present a powerful new approach to screen for interactions across the genome, an approach that shares substantial similarity to the Mendelian randomization framework. We identify and confirm 5 loci (6 independent signals) interacted with either cigarette smoking or alcohol consumption for serum lipids, and empirically demonstrate that interaction and mediation are the major contributors to genetic effect size heterogeneity across populations. The estimated lower bound of the interaction and environmentally mediated heritability is significant (P < 0.02) for low-density lipoprotein cholesterol and triglycerides in Cross-Population data. Our study improves the understanding of the genetic architecture and environmental contributions to complex traits.


Conflict of interest statement

The authors declare no competing interests.

Figures

Fig. 1
Fig. 1. Illumination of Mendelian randomization and G×E.
A Left panel: the path diagram of the MR, where U refers to all confounders. Genetic variants (G) contributing to outcome Y through mediation of exposure X are often selected as the valid genetic instrumental variables (black paths). Genetic variants contributing to Y through both black and red paths independently are horizontal pleiotropic variants. Genetic variants contributing to Y through confounders (U) are invalid instrumental variables and need be blocked (x). Right panel: a scatter plot of effect sizes of genetic instrumental variants for an exposure and an outcome. Each + corresponds to the 95% confidence intervals of the exposure effect size (horizontal line segment) and the outcome effect size (vertical line segment). The horizontal pleiotropic variants (red +) depart from the regression line and can be separated from the variants with no pleiotropic effect (blue +). B Left panel: the G×E framework, with the goal of testing G×E. Instead of an explicit exposure, we create a pseudo exposure X~, which can be viewed as a polygenic score for trait Y based on marginal effect sizes. However, our analysis does not require estimating this pseudo exposure. The genetic variants associated with the pseudo exposure X~ but not through either the environment E or G×E are valid instrumental variables. The genetic variants interacting with E can be viewed the same as horizontally pleiotropic variants in the MR framework. Genetic variants associated with Y via mediation through E can contribute to both the pseudo exposure X~ and Y, and thus have similar effects as G×E and cannot be distinguished from G×E. Thus, testing the combined effect of interaction and mediation is conceptually equivalent with testing the horizontally pleiotropic effect in the MR framework. Right panel: a scatter plot of genetic variants for GWIS main effects and GWAS marginal effects. Each + corresponds to the 95% confidence intervals of the GWIS main effect size (horizontal line segment) and the GWAS marginal effect size (vertical line segment). Like the horizontal pleiotropic variants in the MR framework, G×E variants (red +) depart from the regression line and can be separated from variants with no G×E assuming no mediation.
Fig. 2
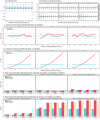
Fig. 2. Simulation performance of TMR_GXE and the two-step procedure.
AD No medication was present. The simulation details were described in “Methods”. A Box plots of θ^ in simulations under different environments in GWAs data. The top and bottom edges of the box plots represent the 25th and 75th percentiles of θ^, and the horizontal middle line represents the 50th percentile. The vertical bars extend from the 25th (or 75th) percentile of θ^ to the minimum (or maximum) value of simulated data. Eθ^ is close to 1 as expected. B Box plots of the direct estimate of β3 in GWIS (top panel) and by α^β^1θ^/μe through MR- G×E analysis (bottom panel). The box plots are interpreted the same as in (A) accordingly. Both the estimates of β3 and that by α^β^1θ^/μe are unbiased. Here s = −1 refers to the scenario when the main effect and interaction effect have opposite effect directions; s = 0 refers to no main effect; and s = 1 refers to the scenario when the main effect and interaction effect have the same effect direction. C Type I error rate comparison between TMR_GxE and the direct test for different main and interaction effect directions. Both TMR_GxE and the direct test maintain the type I error rate well. D Power comparison between TMR_GxE and the direct test for different main and interaction effect directions. E, F 20 variants were tested when mediation was present or not. The simulation details were described in ”Methods”. E Type I error comparison for TDirect, TMR_GxE and two-step procedure. The dash lines represent the 95% confidence interval. F Power comparison for TDirect, TMR_GxE and two-step procedure.
Fig. 3
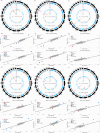
Fig. 3. Manhattan plots, marginal and main effect size comparisons.
The circle Manhattan plots of gene × alcohol drinking interactions for A LDL-C; B HDL-C; and C TG, respectively. The genome-wide significant loci are presented in red dots. The marginal and main effect sizes corresponding to alcohol drinking for D LDL-C; E HDL-C, and F TG, respectively. The colored circles represent the genome-wide significant loci and gray circles represent insignificant loci by TMR_GXE test. The circle Manhattan plots of gene × cigarette smoking interactions for G LDL-C; H HDL-C; and I TG, respectively. The marginal and main effect sizes corresponding to cigarette smoking for J LDL-C; K HDL-C, and L TG, respectively.
Fig. 4
Fig. 4. The estimated heritability of HDL-C, LDL-C, and TG using LDSC regression.
A Cross-Population. B European population. X-axis represents heritability in percentage. Y-axis represents the corresponding heritability estimated in percentage (marginal.effect: marginal effect heritability; current.drinking: gene and current drinking interaction effect heritability; regular.drinking: gene and regular drinking interaction effect heritability; current.smoking: gene and current smoking interaction effect heritability; ever.smoking: gene and ever smoking interaction effect heritability). Marginal effect heritability refers to the heritability estimated through the marginal effect α^, and interaction effect heritability refers to the heritability estimated through α^θ^β^1. The percentage number displayed on the right side of each bar represents the estimated heritability, and the corresponding 95% confidence interval shown as horizontal error bars. For the marginal effect analysis, the sample size is 1.65 M and 1.32 M for cross-population and European population analysis, respectively. For the interaction effect analysis, the sample size is 134 K and 80 K for cross-population and European population analysis, respectively.
Fig. 5
Fig. 5. Cross-population comparison of the LDL-C, HDL-C, and TG marginal effect sizes of the variants reported in Graham et al..
A EUR vs AFR, no G×E interaction or mediation. B EUR vs AFR, G×E interaction or mediation. C EUR vs HIS, no G×E interaction or mediation. D EUR vs HIS, G×E interaction or mediation. E EUR vs EAS, no G×E interaction or mediation. F EUR vs EAS, G×E interaction or mediation. G AFR vs HIS, no G×E interaction or mediation. H AFR vs HIS, G×E interaction or mediation. I AFR vs EAS, no G×E interaction or mediation. J AFR vs EAS, G×E interaction or mediation. K HIS vs EAS, no G×E interaction or mediation. L HIS vs EAS, G×E interaction or mediation. The variants with no G×E interaction or mediation are those not included in Supplementary Data S3a. The variants with G×E interaction or mediation are those in Supplementary Data S3a. We only included independent variants. The shadow error bands represent the 95% confidence intervals. Clearly the variants without G×E interactions or mediations have substantially larger cross-population correlations than the variants with G×E interactions or mediations, suggesting that G×E interactions or mediations contribute the marginal effect size heterogeneity across populations. (European (EUR), African (AFR), Hispanics (HIS), Eastern Asian (EAS)).

Update of

Similar articles

Cited by

References

    1. Manolio TA. Genomewide association studies and assessment of the risk of disease. N. Engl. J. Med. 2010;363:166–176. doi: 10.1056/NEJMra0905980. - DOI - PubMed
    1. Wang WY, Barratt BJ, Clayton DG, Todd JA. Genome-wide association studies: theoretical and practical concerns. Nat. Rev. Genet. 2005;6:109–118. doi: 10.1038/nrg1522. - DOI - PubMed
    1. Graham SE, et al. The power of genetic diversity in genome-wide association studies of lipids. Nature. 2021;600:675–679. doi: 10.1038/s41586-021-04064-3. - DOI - PMC - PubMed
    1. Yengo L, et al. A saturated map of common genetic variants associated with human height. Nature. 2022;610:704–712. doi: 10.1038/s41586-022-05275-y. - DOI - PMC - PubMed
    1. Abdellaoui A, Yengo L, Verweij KJH, Visscher PM. 15 years of GWAS discovery: realizing the promise. Am. J. Hum. Genet. 2023;110:179–194. doi: 10.1016/j.ajhg.2022.12.011. - DOI - PMC - PubMed

Publication types

LinkOut - more resources