. 2024 Feb;21(2):267-278.
doi: 10.1038/s41592-023-02124-2. Epub 2024 Jan 8.

Unsupervised and supervised discovery of tissue cellular neighborhoods from cell phenotypes

Affiliations

Unsupervised and supervised discovery of tissue cellular neighborhoods from cell phenotypes

Yuxuan Hu et al. Nat Methods. 2024 Feb.

Abstract

It is poorly understood how different cells in a tissue organize themselves to support tissue functions. We describe the CytoCommunity algorithm for the identification of tissue cellular neighborhoods (TCNs) based on cell phenotypes and their spatial distributions. CytoCommunity learns a mapping directly from the cell phenotype space to the TCN space using a graph neural network model without intermediate clustering of cell embeddings. By leveraging graph pooling, CytoCommunity enables de novo identification of condition-specific and predictive TCNs under the supervision of sample labels. Using several types of spatial omics data, we demonstrate that CytoCommunity can identify TCNs of variable sizes with substantial improvement over existing methods. By analyzing risk-stratified colorectal and breast cancer data, CytoCommunity revealed new granulocyte-enriched and cancer-associated fibroblast-enriched TCNs specific to high-risk tumors and altered interactions between neoplastic and immune or stromal cells within and between TCNs. CytoCommunity can perform unsupervised and supervised analyses of spatial omics maps and enable the discovery of condition-specific cell-cell communication patterns across spatial scales.


Conflict of interest statement

The authors declare no competing interests.

Figures
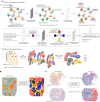
Fig. 1
Fig. 1. Schematic diagram of the CytoCommunity algorithm.
Given single-cell spatial maps with cell phenotype annotation and cell spatial coordinates, TCN identification is formulated as a community detection problem on graphs. a, The algorithm includes a soft TCN assignment module and a TCN ensemble module. First, a k-NN-based cellular spatial graph is constructed using cell spatial coordinates. Each node represents a cell and its m-dimensional attribute vector (blue) encodes the cell phenotype. m, number of cell phenotypes; n, number of cells. A basic GNN is applied to this cellular spatial graph to obtain a d-dimensional embedding vector (green) for each node. Embedding dimensions are specified according to users. A fully connected neural network is used to transform cell node embeddings to soft TCN assignments (yellow vectors) of nodes, representing the probabilities of cells belonging to c TCNs. The number of TCNs are specified according to users. The graph MinCut-based loss function (LMinCut) is used to learn the optimal soft TCN assignments of all nodes. This loss function can be used alone for an unsupervised learning task. In a supervised learning task, differentiable graph pooling, graph convolution and two fully connected layers with the cross-entropy loss function LCE (for sample classification, bordered by a dashed rectangular box) are added on top of the soft TCN assignment module. The overall supervised loss function is a linear combination of LMinCut and LCE with a weight parameter β. In the TCN ensemble module, the first module can be run multiple times to generate multiple optimal soft TCN assignment matrices. Hard assignment is conducted for each of them and an ensemble procedure is performed on those hard TCN assignments using a majority vote strategy to determine the final robust TCNs. b, For an unsupervised learning task, CytoCommunity identified TCNs for each tissue sample individually. c, For a supervised learning task, using a dataset of tissue samples associated with different conditions as the input, CytoCommunity enabled de novo identification of condition-specific TCNs under the supervision of sample labels.
Fig. 2
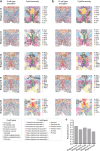
Fig. 2. Performance evaluation of the unsupervised CytoCommunity algorithm using single-cell spatial proteomics data.
a,b, Three single-cell spatial images, BALB/c-1, BALB/c-2 and BALB/c-3, generated from healthy mouse spleen samples using the CODEX technology. Cells are colored based on cell-type annotation (a) or manual tissue compartment annotation (b) from the original study. ce, TCNs identified by CytoCommunity (c), two methods (Spatial-LDA and UTAG) originally designed for spatial proteomics data (d) and three methods (STAGATE, BayesSpace and stLearn) originally designed for spatial transcriptomics data (e). f, Macro-F1 and AMI scores computed based on manually annotated TCNs. Each data point represents the performance on one image; the horizontal bars represent the mean across n = 3 images. Performances (points) on the same image are connected by gray dashed lines. P values were computed using a one-sided paired t-test. Note that only UTAG identified seven TCNs in the BALB/c-3 image, while all other methods identified four TCNs in all three images. mphs, macrophages; DNT, TCRα+CD4CD8 double-negative T [cell]; NS, not significant.
Fig. 3
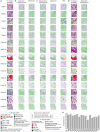
Fig. 3. Performance evaluation of the unsupervised CytoCommunity algorithm using single-cell spatial transcriptomics data.
a, Five single-cell spatial images—Bregma −0.14, Bregma −0.04, Bregma +0.06, Bregma +0.16 and Bregma +0.26—of mouse hypothalamic preoptic region generated using the MERFISH technology. The Bregma distance is given for each imaged brain section. Cells are colored based on the cell-type annotation from the original study. b, Left, the 9, 10, 12, 12 and 11 hypothalamic nuclei or regions in the images were manually outlined by the authors of the original study. Right, cells were manually assigned TCN membership based on the nuclei outlined on the left. ce, TCNs identified by CytoCommunity (c), Spatial-LDA and UTAG (d), and STAGATE, BayesSpace and stLearn (e). TCNs are labeled and colored based on the most similar manually annotated nuclei regions. TCNs without labels could not be matched to the manual annotation. f, Macro-F1 and AMI scores were computed using the manually annotated hypothalamic nuclei in b. Each point represents the performance on a given single-cell spatial image; the horizontal bars represent the mean across n = 5 images. Performances (points) on the same images are connected by gray dashed lines. P values were computed using a one-sided paired t-test. 3V, third ventricle; BAC, bed nucleus of the anterior commissure; Fx, fornix; LPO, lateral preoptic area; PS, parastrial nucleus; PVA, paraventricular thalamic nucleus; StHy, striohypothalamic nucleus.
Fig. 4
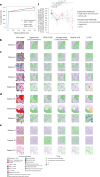
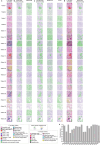
Fig. 4. Performance evaluation of the supervised CytoCommunity algorithm using stratified single-cell spatial proteomics data.
a, ROC curves for the image label (compartmentalized versus mixed tumors) prediction. The AUCs for CytoCommunity and SPACE-GM represent the mean values of ten sets of tenfold cross-validations. be, Representative single-cell images of the compartmentalized (bd) and mixed (e) tumors from patients with triple-negative breast cancer. Cells are colored based on the cell-type annotation from the original study (first column) or TCNs identified using two supervised methods, supervised CytoCommunity and SPACE-GM, and three unsupervised methods, that is, unsupervised CytoCommunity, Spatial-LDA and UTAG. b, Tissue image of patient no. 4 on which all methods showed good performance, except for SPACE-GM. c, Tissue images on which supervised and unsupervised CytoCommunity showed better performance than three other methods. d, Tissue images on which supervised CytoCommunity showed better performance than all other methods. Mis-assigned regions by the compared methods are indicated by the arrowheads in the cell-type maps. e, Representative single-cell images of the mixed tumors from patients with triple-negative breast cancer. f, Fractions of neoplastic and immune cells correctly assigned to the neoplastic cell-dominated and immune cell-dominated TCNs. Each point represents performance on a given compartmentalized tumor image; the horizontal bars represent the mean across n = 15 images. Performances (points) on the same images are connected by gray dashed lines. P values were computed using a one-sided paired t-test. Note that the number of TCNs were set to two for CytoCommunity, SPACE-GM and Spatial-LDA. Clustering resolution was set to 0.05 for UTAG, resulting in one or two identified TCNs in most images but three or four identified TCNs in the rest of the images.
Fig. 5
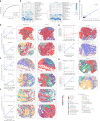
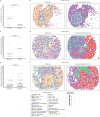
Fig. 5. Coordinated neoplastic and immune cell-type distributions within or between TCNs in CRC.
a, ROC curves for image label (CLR versus DII) prediction. The AUCs for CytoCommunity and SPACE-GM represent the mean values of ten sets of tenfold cross-validations. b, Heatmaps of the average enrichment scores of each cell type in each identified TCN across all images of the CLR and DII patient samples. Cell type enrichment score was defined as −log10(P). P values were computed using hypergeometric tests and adjusted with the Benjamini–Hochberg method. c, Correlation of average cell-type enrichment scores in all identified TCNs between CLR and DII patients. df, Correlation of the enrichment scores of two indicated cell types in TCN-6 (d), TCN-4 (e) or TCN-8 (f) in each patient group (left). Representative cell-type and TCN maps (middle and right) are based on patient samples indicated by a dashed circle in the scatter plots. g,h, Significant canonical correlation (permutation test P < 0.1) between two TCNs in the CLR (g) and DII (h) patient groups. Scatter plots of normalized weights of dominant cell types (observed variable) in each TCN in the first two canonical variate pairs (top left) are shown. Correlation of the enrichment scores of dominant cell types in the first canonical variate pair (bottom left), and representative cell-type and TCN maps (right), are also shown. The black dashed ellipses and rectangles in the cell-type and TCN maps in h are used to highlight the colocalization of smooth muscle cells in TCN-1 and neoplastic cells in TCN-7. For all scatter plots, regression lines, Spearman rank correlation coefficients (ρ) and two-sided Spearman ρ test P values are shown. For clarity, cells of the studied types and TCNs have been magnified without transparency in all cell-type and TCN maps.
Fig. 6
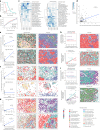
Fig. 6. Coordinated neoplastic and stromal cell-type distributions within or between TCNs in breast cancer.
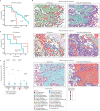
a, Kaplan–Meier survival curves of 79 patients with breast cancer who were classified into low-risk and high-risk groups based on their median OS time. The P value was computed using the log-rank test. b, ROC curves for the image label (low-risk versus high-risk) prediction. The AUC values for CytoCommunity and SPACE-GM represent the mean values of ten sets of tenfold cross-validations. c, Heatmaps of the average enrichment scores of each cell type in each identified TCN across all images of low-risk and high-risk patient samples. Cell type enrichment score was defined as −log10(P). P values were computed using hypergeometric tests and adjusted using the Benjamini–Hochberg method. d, Correlation of average cell-type enrichment scores in all identified TCNs between low-risk and high-risk patients. eg, Correlation of the enrichment scores of two indicated cell types in TCN-1 (e and f) or TCN-4 (g) in each patient group (left). Representative cell-type and TCN maps (middle and right) are based on patient samples indicated by a dashed circle in the scatter plots. h,i, Significant canonical correlation (permutation test P < 0.1) between TCN-4 and TCN-2 (h) and between TCN-4 and TCN-5 (i) in the high-risk patient group. The scatter plots of normalized weights of the dominant cell types (observed variable) in each TCN in the first two canonical variate pairs (top left) are shown. Correlation of the enrichment scores of the dominant cell types in the first canonical variate pair (bottom left), and representative cell-type and TCN maps (right), are also shown. For all scatter plots, regression lines, Spearman rank correlation coefficients (ρ) and two-sided Spearman ρ test P values are shown. For clarity, cells of the studied types and TCNs have been magnified without transparency in all cell-type and TCN maps.
Extended Data Fig. 1
Extended Data Fig. 1. Robustness assessment of CytoCommunity performance using different values of K in K-nearest-neighbor graphs.
(a) Assessment using the mouse hypothalamic preoptic region MERFISH dataset. (b) Assessment using the human triple-negative breast cancer (TNBC) MIBI-TOF dataset. Robustness score is defined as the average Jaccard index between original TCN partitions and new TCN partitions generated using different K values. SRM, square root of the average number of cells (SRM) across images in the dataset. K values were varied around the SRM values. Each black point represents the robustness performance on a given single-cell spatial image (n = 5 for the MERFISH dataset and n = 34 for the MIBI-TOF dataset). Blue horizontal bars represent the means of each group.
Extended Data Fig. 2
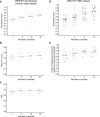
Extended Data Fig. 2. Effect of number of models of the ensemble procedure on the performance of CytoCommunity.
(a-c) Unsupervised CytoCommunity was applied to the mouse hypothalamic preoptic region MERFISH dataset using different number of models learned from the soft TCN assignment module. The effect of number of models on the robustness (a) and accuracy including Macro-F1 score (b) and adjusted mutual information (AMI) score (c) was assessed. Macro-F1 score and AMI score were computed by comparing TCN partitions generated using different number of models with manually annotated hypothalamic nuclei (Fig. 3b). Robustness score was computed as the average Jaccard index between those TCN partitions and new TCN partitions generated by additional three replicated experiments. Each black point represents the robustness or the accuracy performance on a given MERFISH image (n = 5). (d, e) Supervised CytoCommunity was applied to the human TNBC MIBI-TOF dataset using different number of models trained based on a 10-fold cross-validation. The effect of number of models on the robustness (d) and accuracy (e) was assessed. Robustness score was computed the same as before and each black point represents the robustness performance on a given compartmentalized or mixed tumor image (n = 34). Accuracy performance was evaluated using the fractions of neoplastic and immune cells correctly assigned to the neoplastic- and immune-dominated TCNs. Each black point represents the accuracy performance on a given compartmentalized tumor image (n = 15). For all panels, blue horizontal bars represent the means of each group with grey dashed lines connecting them.
Extended Data Fig. 3
Extended Data Fig. 3. Robustness assessment of CytoCommunity performance using different granularity of annotated cell types.
Mouse hypothalamic preoptic region MERFISH dataset was used due to the complex cell types in this tissue. (a) Cell types and TCNs identified using 9 coarse-grained cell type annotations as the input. (b) Cell types and TCNs identified using 15 fine-grained cell type annotations as the input. Both sets of cell type annotations were downloaded from the original study. (c) Robustness score is defined as the average Jaccard index between the two sets of TCNs generated using the two sets of cell type annotations.
Extended Data Fig. 4
Extended Data Fig. 4. Performance evaluation using MIBI-TOF data of compartmentalized tumors from triple-negative breast cancer patients.
15 single-cell-resolution images of compartmentalized tumors generated using the MIBI-TOF technology. (a) Cells are colored based on 17 cell types annotated by the original study. (b-c) TCNs identified by supervised (b) and unsupervised methods (c). (d) Left, cells are colored based on 11 cell types by combining similar cell types annotated by the original study into a single major cell type. Specifically, two neoplastic cell types are combined into one neoplastic cell type. Four T cell subtypes are combined into a single T cell cluster. Two mixed cell type clusters and macrophages are combined into a single monocyte cluster. Right, TCNs identified by CytoCommunity. (e) Robustness score is defined as the average Jaccard index between the two sets of TCNs generated using the two sets of cell type annotations.
Extended Data Fig. 5
Extended Data Fig. 5. Performance evaluation using MIBI-TOF data of mixed tumors from triple-negative breast cancer patients.
19 single-cell-resolution images of mixed tumors generated using the MIBI-TOF technology. (a) Cells are colored based on 17 cell types annotated by the original study. (b-c) TCNs identified by supervised (b) and unsupervised methods (c). (d) Left, cells are colored based on 11 cell types. Right, TCNs identified by CytoCommunity. (e) Robustness score is defined as the average Jaccard index between the two sets of TCNs generated using the two sets of cell type annotations.
Extended Data Fig. 6
Extended Data Fig. 6. Analysis of TCNs in colorectal cancer identified by the original study.
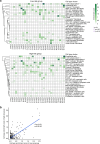
(a) Heatmaps of average enrichment scores of each cell type in each identified TCN across all tissue sections of CLR and DII patient samples. Cell type enrichment score is defined as -log10(P-value). P-values were computed using hypergeometric tests and adjusted using Benjamini-Hochberg method. (b) Spearman’s rank correlation coefficient (Corr) of average cell type enrichment scores in all identified TCNs between CLR and DII patients and the two-sided Spearman’s rho test p-value are shown.
Extended Data Fig. 7
Extended Data Fig. 7. Representative TCNs specific to low- and high-risk colorectal cancer patients.
(a) Comparison of B cell enrichment scores in TCN-1 between CLR patients and DII patients (n = 17 and 18 for the CLR and DII groups, respectively). (b) Cell type and TCN maps of a representative CLR patient image with B cells enriched in TCN-1. (c) Comparison of granulocyte enrichment scores in TCN-2 between CLR patients and DII patients (n = 17 and 18 for the CLR and DII groups, respectively). (d) Cell type and TCN maps of a representative DII patient image with granulocytes enriched in TCN-2. (e) Comparison of neoplastic cell enrichment scores in all TCNs between CLR patients and DII patients (n = 136 and 144 for the CLR and DII groups, respectively). (f) Cell type and TCN maps of a representative DII patient image with neoplastic cells enriched in TCN-6. In all jitter plots, horizontal bars represent the means across data points. P-values were computed using one-sided t-tests. For clarity, cells of studied types and TCNs are shown in larger size without transparency in all cell type and TCN maps.
Extended Data Fig. 8
Extended Data Fig. 8. Analysis of TCNs in breast cancer identified by the original study.
(a) Heatmaps of average enrichment scores of each cell type in each identified TCN across all tissue sections of low-risk and high-risk patient samples. Cell type enrichment score is defined as -log10(P-value). P-values were computed using hypergeometric tests and adjusted using Benjamini-Hochberg method. (b) Spearman’s rank correlation coefficient (Corr) of average cell type enrichment scores in all identified TCNs between low-risk and high-risk patients and the two-sided Spearman’s rho test p-value are shown.
Extended Data Fig. 9
Extended Data Fig. 9. Representative TCNs specific to low- and high-risk breast cancer patients.
(a) Comparison of CK+ HRhi neoplastic cell enrichment scores in TCN-2 or TCN-5 between low-risk and high-risk patients (n = 68 and 90 for the low- and high-risk groups, respectively). (b) Cell type and TCN maps of a representative low-risk patient with CK+ HRhi neoplastic cells enriched in TCN-5. (c) Comparison of endothelial cell and Vimentinhi fibroblast enrichment scores in TCN-4 between low-risk and high-risk patients (n = 34 and 45 for the low- and high-risk groups, respectively). (d) Cell type and TCN maps of a representative high-risk patient with both endothelial cell and Vimentinhi fibroblast enriched in TCN-4. In all jitter plots, horizontal bars represent the means across data points. P-values were computed using one-sided t-tests. For clarity, discussed cell types and TCNs are shown in larger size without transparency in all cell type and TCN maps.
Extended Data Fig. 10
Extended Data Fig. 10. Prognosis ability of TCNs identified in breast cancer.
(a) Kaplan-Meier survival curves of high-risk breast cancer patients who were clustered into three subgroups based on cell type enrichment scores of TCNs. Subgroup 3 was removed from the survival analysis since it does not contain more than three patients. (b) Kaplan-Meier survival curves of high-risk breast cancer patients who were assigned into 18 single-cell pathology (SCP) subgroups by the original study. Two SCP subgroups with more than three patients were used for survival analysis. P-values between survival curves were computed using the log-rank test. (c) Comparison of four cell type (including small elongated fibroblasts, Vimentinhi fibroblasts, T cells and macrophages) enrichment scores in TCN-4 between high-risk patients (points) in the TCN-induced subgroup 1 and subgroup 2 (shown in panel a). Horizontal bars represent the means across patients. P-value was computed using one-sided t-test (n = 40 and 3 for the TCN-induced subgroup 1 and subgroup 2, respectively). (d) Cell type and TCN maps of three patients in TCN-induced subgroup 2 with the four cell types (shown in panel c) significantly enriched in TCN-4. For clarity, cells of studied types and TCNs are shown in larger size without transparency in all cell type and TCN maps.

Similar articles

Cited by

References

    1. Rao A, Barkley D, França GS, Yanai I. Exploring tissue architecture using spatial transcriptomics. Nature. 2021;596:211–220. doi: 10.1038/s41586-021-03634-9. - DOI - PMC - PubMed
    1. Zhu Q, Shah S, Dries R, Cai L, Yuan G-C. Identification of spatially associated subpopulations by combining scRNAseq and sequential fluorescence in situ hybridization data. Nat. Biotechnol. 2018;36:1183–1190. doi: 10.1038/nbt.4260. - DOI - PMC - PubMed
    1. Schürch CM, et al. Coordinated cellular neighborhoods orchestrate antitumoral immunity at the colorectal cancer invasive front. Cell. 2020;182:1341–1359. doi: 10.1016/j.cell.2020.07.005. - DOI - PMC - PubMed
    1. Dries R, et al. Giotto: a toolbox for integrative analysis and visualization of spatial expression data. Genome Biol. 2021;22:78. doi: 10.1186/s13059-021-02286-2. - DOI - PMC - PubMed
    1. Zhao E, et al. Spatial transcriptomics at subspot resolution with BayesSpace. Nat. Biotechnol. 2021;39:1375–1384. doi: 10.1038/s41587-021-00935-2. - DOI - PMC - PubMed

LinkOut - more resources