[Preprint]. 2023 Dec 8:2023.12.06.570168.
doi: 10.1101/2023.12.06.570168.

Integrating Multiplexed Imaging and Multiscale Modeling Identifies Tumor Phenotype Transformation as a Critical Component of Therapeutic T Cell Efficacy

Affiliations

Integrating Multiplexed Imaging and Multiscale Modeling Identifies Tumor Phenotype Transformation as a Critical Component of Therapeutic T Cell Efficacy

John W Hickey et al. bioRxiv. .

Update in

Abstract

Cancer progression is a complex process involving interactions that unfold across molecular, cellular, and tissue scales. These multiscale interactions have been difficult to measure and to simulate. Here we integrated CODEX multiplexed tissue imaging with multiscale modeling software, to model key action points that influence the outcome of T cell therapies with cancer. The initial phenotype of therapeutic T cells influences the ability of T cells to convert tumor cells to an inflammatory, anti-proliferative phenotype. This T cell phenotype could be preserved by structural reprogramming to facilitate continual tumor phenotype conversion and killing. One takeaway is that controlling the rate of cancer phenotype conversion is critical for control of tumor growth. The results suggest new design criteria and patient selection metrics for T cell therapies, call for a rethinking of T cell therapeutic implementation, and provide a foundation for synergistically integrating multiplexed imaging data with multiscale modeling of the cancer-immune interface.

Keywords: Multiplexed tissue imaging; T cells; Vivarium; agent-based modeling; cellular therapy; computational analysis of tissue imaging data; immunotherapy; multiscale modeling; spatial biology; systems biology; theory experiment cycle; tumor cell phenotype.


Conflict of interest statement

DECLARATION OF INTERESTS GPN has equity in and is a scientific advisory board member of Akoya Biosciences, Inc. The other authors declare no competing interests.

Figures

Figure 1:
Figure 1:
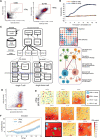
Cancer is a system of network interactions, and its analysis requires methods that can deconstruct and reconstruct the complexity at multiple scales. A) At the tissue scale, multicellular neighborhoods form to make larger tissue structures and organs. At the cellular scale, cells engage with each other through intermolecular interactions, and intracellular interactions mediate cellular function. B) CODEX imaging enables multiplexed molecular measurements of 50 or more proteins that can be quantified at a single-cell level. These molecular profiles can be used to define both cell types and states. Using the spatial features of the data, multicellular structures can be identified based on conserved composition. Finally, network interactions across these scales can be interpreted to fully deconstruct the complexity of a tissue. C) Multiscale modeling enables reconstruction of complex biology across scales. Models are defined by molecular rules for cell agents that facilitate interactions. These interactions happen within a spatial microenvironment that result in emergent biological behavior. Models can guide hypothesis generation.
Figure 2:
Figure 2:
Changing tumor phenotype to an inflammatory state enhances T cell recognition and killing. A) PDL1 and H2Db per cell levels as measured by CyTOF of B16-F10 tumor cells after being incubated with IFNγ or no IFNγ for 18 h. B) Percent killing of cognate tumor cells over time by expanded therapeutic T cells pre-incubated with IFNγ or not. Tumor and T cells were incubated at a 1:1 ratio (mean of n=3 replicates with error bars showing SEM). C) Multiscale agent-based model of the tumor microenvironment used to understand critical components governing efficacy of adoptive T cell therapies at multiple levels of scale. D) Evaluation of per cell levels of effector molecules, granzymeB and IFNγ, of restimulated therapeutic PMEL CD8+ T cells after 10 days of activation. E) Snapshots of agent-based modeling results showing results from a simulation that was initialized to mirror in vitro killing by expanded therapeutic T cells pre-incubated with IFNγ or not. F) Cytotoxicity levels from multiscale agent-based modeling of initializing simulations with tumors that had similar phenotype to input tumor cells in Figure 2B indicating being treated with or without IFNγ (mean of n=5 replicates with shading showing SEM).
Figure 3:
Figure 3:
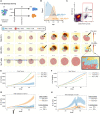
The initial phenotype of transferred therapeutic T cells influences the ability of T cells to convert tumor cells to an inflammatory phenotype. A) Experimental layout for controlling T cell phenotype during ex vivo T cell expansion. B) Histogram of per cell levels of PD1 expression as measured by CyTOF of T cells treated with metabolic inhibitor 2HC or without the inhibitor. C) Percent of CD8+ T cells within tumors post-treatment with therapeutically expanded T cells as measured by flow cytometry. D) Snapshots of simulation initialized with in vivo-relevant cell numbers, ratios, and T cell phenotypes for 25% and 75% PD1+ T cell conditions compared to a simulation condition with no T cells. E) Total number of tumor cells over the course of the simulation that was 3 biological days under each condition. F) The number of tumor cell deaths over the time course of the simulation. G) Number of tumor cells separated by phenotype over the course of the simulation. H) Number of T cells separated by phenotype over the course of the simulation. For panels E-H: mean of n=4 replicates with shading showing SEM.
Figure 4:
Figure 4:
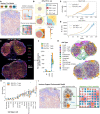
T cells induce tumor cell phenotype conversion in vivo. A) Experimental layout for in vivo adoptive T cell therapy and CODEX multiplexed imaging of tumors at day 3 post-treatment. B–D) CODEX multiplexed imaging results in single-cell data that is spatially resolved. Scatter plots for each treatment condition plotted for each cell in B) X vs. Y, C) CD45 vs. TCRb, and D) gated T cells (red) in the X vs. Y axis together with PDL1+ MHCI+ tumor cells (blue)—to see spatial distribution of T cells in the tumor samples. E) Multicellular neighborhood analysis for each of the simulations at the day 3 endpoint reveals differential structures created by each of the responses, where responses are characterized into 5 overall neighborhoods. F–I) Correlation plots between percent of cells resulting after three days of T cell therapy for both CODEX multiplexed imaging of in vivo experiments and in silico simulations for F) PDL1+ tumor cells, G) PDL1− tumor cells, and H) PD1− CD8+ T cells. I) PD1− to PD1+ T cell ratio for agent-based modeling (ABM) and in vivo (CODEX) experiments.
Figure 5:
Figure 5:
Spatial location of T cells impacts ability to maintain phenotype. A) Left: CODEX multiplexed data is amenable to initialize multiscale-agent based models because it has single-cell information of cell type, X & Y positions, and molecular protein expression. Middle: Cell-type maps of CODEX images of tumor sections. Rectangles indicate subsets of 2000 cells used to initialize the model. Right: High-magnification images of the areas indicated by rectangles in the middle panels. B) Number of tumor cells in T cell-treated and control groups as a function of simulation time (mean of n=4 replicates with shading showing SEM). C) Number of PD1+ and PD1 T cells in each T cell-treated groups as a function of simulation time (mean of n=4 replicates with shading showing SEM). D) Percent of PD1+ and PD1 T cells at the end of the 72-hour simulation started either with initial conditions of 25% PD1+ T cells (used for Fig. 3H) or the conditions based on CODEX data (used in Fig. 5C) (average of n=4 simulations for both conditions). E) Snapshots of the tumor from agent-based modeling condition 25% PD1+ T cell and 75% PD1+ T cells from simulations initialized with CODEX data that illustrate spatial restrictions of T cells and zoomed in regions to indicate phenotype status of T cells over time.
Figure 6:
Figure 6:
Conversion of tumor cell phenotype is more critical for tumor control than T cell phenotype preservation. A) Theoretical sketch of how T cells are able to escape the tumor microenvironment to promote long-term survival and ability to control the tumor. B) Snapshots of the tumor from agent-based modeling of a tumor treated with 25% PD1+ T cells that were initialized outside the tumor such that they can escape chronic exposure to tumor and limit exhaustion. C) Total number of T cells over time of simulation when T cells are initialized outside the tumor bed or inside the tumor (mean of n=4 replicates with shading showing SEM). D) Total number of tumor cells over time of simulation when T cells are initialized outside the tumor bed or inside the tumor (mean of n=4 replicates with shading showing SEM). E) Model of T cells supported by immune cells in a microenvironment within the tumor for preservation of phenotype, proliferation, killing, and tumor inhibition locally. F) Percentages of indicated adaptive immune cells in total cells in CODEX multiplexed images of tumors treated with 25% PD1+ T cells, 75% PD1+ T cells, or no T cells. G) Percentages of indicated innate immune cells in total cells from the CODEX multiplexed images from CODEX multiplexed images of tumors treated with 25% PD1+ T cells, 75% PD1+ T cells, or no T cells.
Figure 7:
Figure 7:
Integrating Multiplexed Imaging and Multiscale Modeling Identifies Tumor Phenotype Transformation as a Critical Component of Therapeutic T Cell Efficacy. A) Implementing both multiplexed imaging and multiscale models simultaneously allowed us to exploit a theory-experiment cycle that both enriched hypotheses for targeted experiments and improved model design. We reconstructed the complexity of the tumor microenvironment across multiple biological scales by creating data-informed multiscale agent-based models. We incorporated molecular switches of cellular phenotype and function that led to tissue-level phenomena. We also deconstructed the complexity of the tumor microenvironment across multiple biological scales by using CODEX to image 42 molecular markers quantified at the single-cell level. B) T cell phenotype also impacts its ability to change tumor phenotype, and a focus on converting tumor phenotype results in greater control than minimizing T cell exhaustion. C) Spatial analysis of CODEX and in silico experiments demonstrated that the spatial positioning of T cells influenced T cell phenotype.

Similar articles

References

    1. Agmon E., Spangler R.K., Skalnik C.J., Poole W., Peirce S.M., Morrison J.H., and Covert M.W. (2021). Vivarium: an interface and engine for integrative multiscale modeling in computational biology. - PMC - PubMed
    1. Ahmed N., Brawley V.S., Hegde M., Robertson C., Ghazi A., Gerken C., Liu E., Dakhova O., Ashoori A., and Corder A. (2015). Human epidermal growth factor receptor 2 (HER2)–specific chimeric antigen receptor–modified T cells for the immunotherapy of HER2-positive sarcoma. J. Clin. Oncol. 33, 1688. - PMC - PubMed
    1. An G., Mi Q., Dutta-Moscato J., and Vodovotz Y. (2009). Agent-based models in translational systems biology. Wiley Interdiscip. Rev. Syst. Biol. Med. 1, 159–171. - PMC - PubMed
    1. Baertsch M.-A., Nolan G.P., and Hickey J.W. (2021). Multicellular modules as clinical diagnostic and therapeutic targets. Trends in Cancer. - PMC - PubMed
    1. Bhate S.S., Barlow G.L., Schürch C.M., and Nolan G.P. (2021). Tissue schematics map the specialization of immune tissue motifs and their appropriation by tumors. Cell Syst. - PubMed

Publication types

LinkOut - more resources