High-resolution integrated microfluidic probe for mass spectrometry imaging of biological tissues
- PMID: 37827646
- PMCID: PMC10594281
- DOI: 10.1016/j.aca.2023.341830
High-resolution integrated microfluidic probe for mass spectrometry imaging of biological tissues
Abstract
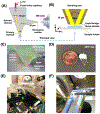
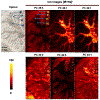
Nanospray desorption electrospray ionization (nano-DESI) is an ambient ionization technique that enables molecular imaging of biological samples with high spatial resolution. We have recently developed an integrated microfluidic probe (iMFP) for nano-DESI mass spectrometry imaging (MSI) that significantly enhances the robustness of the technique. In this study, we designed a new probe that enables imaging of biological samples with high spatial resolution. The new probe design features smaller primary and spray channels and an entirely new configuration of the sampling port that enables robust imaging of tissues with a spatial resolution of 8-10 μm. We demonstrate the spatial resolution, sensitivity, durability, and throughput of the iMFP by imaging mouse uterine and brain tissue sections. The robustness of the high-resolution iMFP allowed us to perform first imaging experiments with both high spatial resolution and high throughput, which is particularly advantageous for high-resolution imaging of large tissue sections of interest to most MSI applications. Overall, the new probe design opens opportunities for mapping of biomolecules in biological samples with high throughput and cellular resolution, which is important for understanding biological systems.
Copyright © 2023 Elsevier B.V. All rights reserved.
Conflict of interest statement
Declaration of competing interest The authors declare no competing financial interest.
Figures


Similar articles
-
Nanospray Desorption Electrospray Ionization Mass Spectrometry Imaging (nano-DESI MSI): A Tutorial Review.ACS Meas Sci Au. 2024 Aug 21;4(5):475-487. doi: 10.1021/acsmeasuresciau.4c00028. eCollection 2024 Oct 16. ACS Meas Sci Au. 2024. PMID: 39430971 Free PMC article. Review.
-
A monolithic microfluidic probe for ambient mass spectrometry imaging of biological tissues.Lab Chip. 2023 Oct 24;23(21):4664-4673. doi: 10.1039/d3lc00637a. Lab Chip. 2023. PMID: 37782224 Free PMC article.
-
High-Throughput Nano-DESI Mass Spectrometry Imaging of Biological Tissues Using an Integrated Microfluidic Probe.Anal Chem. 2022 Jul 12;94(27):9690-9696. doi: 10.1021/acs.analchem.2c01093. Epub 2022 Jun 30. Anal Chem. 2022. PMID: 35770488 Free PMC article.
-
An Integrated Microfluidic Probe for Mass Spectrometry Imaging of Biological Samples*.Angew Chem Int Ed Engl. 2020 Dec 7;59(50):22388-22391. doi: 10.1002/anie.202006531. Epub 2020 Oct 9. Angew Chem Int Ed Engl. 2020. PMID: 32743957 Free PMC article.
-
Mass spectrometry imaging under ambient conditions.Mass Spectrom Rev. 2013 May-Jun;32(3):218-43. doi: 10.1002/mas.21360. Epub 2012 Sep 20. Mass Spectrom Rev. 2013. PMID: 22996621 Free PMC article. Review.
Cited by
-
Nanospray Desorption Electrospray Ionization Mass Spectrometry Imaging (nano-DESI MSI): A Tutorial Review.ACS Meas Sci Au. 2024 Aug 21;4(5):475-487. doi: 10.1021/acsmeasuresciau.4c00028. eCollection 2024 Oct 16. ACS Meas Sci Au. 2024. PMID: 39430971 Free PMC article. Review.
-
Hardware and software solutions for implementing nanospray desorption electrospray ionization (nano-DESI) sources on commercial mass spectrometers.J Mass Spectrom. 2024 Jul;59(7):e5065. doi: 10.1002/jms.5065. J Mass Spectrom. 2024. PMID: 38866597
-
A monolithic microfluidic probe for ambient mass spectrometry imaging of biological tissues.Lab Chip. 2023 Oct 24;23(21):4664-4673. doi: 10.1039/d3lc00637a. Lab Chip. 2023. PMID: 37782224 Free PMC article.
References
MeSH terms
Grants and funding
LinkOut - more resources
Full Text Sources

