. 2023 Aug 16;111(16):2544-2556.e9.
doi: 10.1016/j.neuron.2023.07.013.

A Noelin-organized extracellular network of proteins required for constitutive and context-dependent anchoring of AMPA-receptors

Affiliations

A Noelin-organized extracellular network of proteins required for constitutive and context-dependent anchoring of AMPA-receptors

Sami Boudkkazi et al. Neuron. .

Abstract

Information processing and storage in the brain rely on AMPA-receptors (AMPARs) and their context-dependent dynamics in synapses and extra-synaptic sites. We found that distribution and dynamics of AMPARs in the plasma membrane are controlled by Noelins, a three-member family of conserved secreted proteins expressed throughout the brain in a cell-type-specific manner. Noelin tetramers tightly assemble with the extracellular domains of AMPARs and interconnect them in a network-like configuration with a variety of secreted and membrane-anchored proteins including Neurexin1, Neuritin1, and Seizure 6-like. Knock out of Noelins1-3 profoundly reduced AMPARs in synapses onto excitatory and inhibitory (inter)neurons, decreased their density and clustering in dendrites, and abolished activity-dependent synaptic plasticity. Our results uncover an endogenous mechanism for extracellular anchoring of AMPARs and establish Noelin-organized networks as versatile determinants of constitutive and context-dependent neurotransmission.

Keywords: AMPA-receptor; excitatory neurotransmission; extracellular matrix; long-term potentiation; mass spectrometry; protein-protein interaction; proteomics; secreteted proteins; synaptic plasticity.


Conflict of interest statement

Declaration of interests The authors declare no competing interests.

Figures
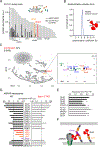
Figure 1
Figure 1. Secreted Noelins interact with native AMPARs and Neuritin in the extracellular milieu.
(A) The 60 most abundant proteins contained in the supernatant of rat brain slice preparations after incubation with (grey bars) or without (black bars) the PI-PLC enzyme releasing GPI-anchored proteins and their extracellular interactors (inset) sorted by their absolute abundance as determined by mass spectrometry (Material and Methods). The GPI-anchored Neuritin1 (Nrn1) and Noelin1 (Noe1) were highlighted, and some established GPI-anchored proteins were indicated for comparison. (B) Sedimentation velocity analytical ultra-centrifugation (AUC) experiment indicating a mass of 297 Da for Noe1 secreted from HEK293-cells (sedimentation coefficient 6.5, frictional ratio of 1.89). This mass is in line with a tetramer of glycosylated monomers. Inset: Domain structure of Noe1, olfmD is olfactomedin domain, NtD is N-terminal domain, ccD is coil-coil domain (adapted from ). (C) t-SNE plot of tnR-values determined for all proteins identified in meAPs with two distinct anti-Noe1 ABs using target-knockout and preimmunization IgGs as negative controls (grey dots; see Material and Methods). Inset on the right is extension of the framed area highlighting Noe1 and the set of closest interaction partners comprising AMPAR constituents, Noe2, Noe3 and Nrn1. (D) MS-derived protein abundances determined for the indicated constituents of the AMPAR interactome from WT and Noe1-3 triple KO mice. Note that deletion of Noe1-3 led to a loss of Nrn1 and Brorin. (E) Abundance ratios measured for the AMPAR pore-forming GluA1-4 proteins and a selected set of membrane/synaptic proteins in unsolubilized membrane fractions (i.e. without addition of detergents) from three TKO and WT mice (AT1A/B1 is α1/β1 subunit of the Na/K-ATPase, PMCA2 is plasma membrane Ca2+-ATPase 2, GluN1 is NR1 subunit of NMDA-receptors). Data are mean (± SEM) determined by three independent MS-measurements (technical replicates); asterisks denote p-values < 0.01 (Students’ T-test). (F) Scheme illustrating the hypothetical interaction between secreted Noe1, Brorin and GPI-anchored Nrn1 derived from experiments in (A)-(D) and literature.
Figure 2
Figure 2. Noelins determine distribution and density of AMPARs in synapses and dendrites and impact neuronal morphology.
(A) Fluorescence images of RNAScope in situ-hybridizations with probes specific for the indicated proteins in hippocampal CA1 (upper panel) and CA3 (lower panel) regions. Note the distinct abundance and patterns of expression (see also Figures S4, S5). DAPI staining of nuclei (images on the left) is in white. (B) Upper left panel, representative CA1 PCs reconstructed after biocytin-filling through the whole-cell patch-pipette (experiments in Figure 3A) from (adult) WT and the indicated Noelin KO mice. Upper right panel, bars summarizing numbers of dendritic intersections determined by Sholl-analysis (mean ± SD of 12, 7, 7, 4 cells for WT, TKO, Noe1 KO and Noe2,3 DKO, respectively; p-values of student’s T-test < 0.001 (three asterisks for all bar-denoted pairs below) or > 0.05 (not significant, n.s.). Middle and lower panels, left: Confocal images of representative dendritic sections, right: Bar graphs summarizing ratio of mature versus immature spines (middle) and number of spines determined in dendritic sections of WT and the indicated Noelin KO neurons. Data are mean ± SD of 11 sections (8 neurons) for WT, and 14 (7), 15 (9), 6 (3) sections for TKO, Noe1 KO and Noe2,3 DKO, respectively; p-values of student’s T-test < 0.001 (three asterisks for all bar-denoted pairs below). Scale bars are indicated. (C) Left panel, electron micrographs illustrating distribution of immuno-particles for GluA1-4 (6 nm; some highlighted by arrowheads) on the plasma membrane of dendritic shafts (den) and spines (s) of CA1 PCs in hippocampi of WT and TKO mice. Scale bars are 200 nm. Right panel, bar graphs summarizing surface densities of AMPARs in GluA-positive synapses and dendrites (mean ± SD of 45 and 74 synapses (WT, TKO) and of 35 and 48 dendrites; p-values < 0.001 for both sites, Student’s T-test), clusters of GluA1-4 particles determined on dendritic shafts and relative contribution of GluA-free synapses to the total pool of synapses. Note the decrease in AMPAR density and the increase in silent synapses induced by the TKO.
Figure 3
Figure 3. Noe1 is required for activity-dependent plasticity in CA3-to-CA1 synapses.
(A) Bar graphs summarizing the amplitudes of AMPAR-mediated sEPSCs or mEPSCs measured in whole-cell recordings in the indicated types of hippocampal and cerebellar neurons of WT, TKO, Noe1 KO and Noe2,3 DKO animals. Data for sEPSCs are mean ± SEM of 10/12/10/9 hilar INs, 10/12/4/3 CA1 PCs, 10/11/4/3 DGs, 10/10 Purkinje cells and 10/10 basket cells (p-values < 0.001 given by three asterisks for all bar-denoted pairs below, Mann-Whitney U-test). Data for mEPSCs are mean ± SEM of 5 WT and TKO neurons (p-values < 0.01, Mann-Whitney U-test). mEPSCs occurred at frequencies of (mean ± SEM) 1.3 ± 0.2 and 2.4 ± 0.7 Hz for WT and TKO neurons, respectively (p-value > 0.05, student’s T-test, not significant). Inset: Representative sEPSCs from hilar interneurons and CA1 PCs; time and current scaling as indicated. Note the distinct reduction of sEPSCs in TKO neurons. (B) Upper panel, input-output relationship determined for Schaffer collaterals-evoked EPSCs in CA1 PCs of WT, Noe1 KO and TKO mice. Data are mean ± SEM of 8 (WT), 6 (Noe1 KO) and 6 (TKO) neurons. Inset: Representative evoked EPSCs recorded in WT and TKO PCs; current and time scaling as indicated. Lower panel, bar graph summarizing the paired-pulse (PP) ratio determined with a stimulation frequency of 10 Hz for CA3-to-CA1 synapses in WT and the indicated Noelin KO neurons. Data are mean ± SEM of 31 (WT), 6 (Noe1 KO), 8 (DKO) and 11 (TKO) CA1 PCs. Inset: Representative PP-ratio recording from WT and TKO neurons; current and time scaling as indicated, arrows indicate time point of stimulation pulses. (C) Amplitudes of EPSCs measured in CA1 PCs upon electrical stimulation before and after LTP induction by the pairing method in brain slices of adult WT and TKO (upper), Noe1 KO (middle) or Noe2,3 DKO (lower) mice. Data are mean ± SEM of 14 WT, 10 TKO, 6 Noe1 KO and 5 Noe2,3 DKO neurons (p < 0.001 for EPSCs marked with the arrowhead; Mann-Whitney U-test). Data for WT were pooled from all WT recordings and used as control for all KOs (see Methods). Right panel, representative EPSCs recorded before (gray) and 20 min after LTP-induction (black and red traces (upper), orange (middle) and brown (lower); arrowhead); current and time scaling as indicated. Note the small and transient induction of LTP in TKO and Noe1 KO mice, while in Noe2,3 DKO neurons LTP was comparable to WT.
Figure 4
Figure 4. Noelins link AMPARs to a network of proteins mediating their extracellular anchoring.
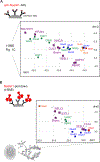
(A) Extension of the t-SNE plot from Figure 1C illustrating all proteins identified as specific interactors of Noe1 (tnR-values > 0.25) in the anti-Noe1 APs. Color-coding for constituents of AMPAR assemblies as in Figure 1C, all extracellular interactors are shown by squares in purple. (B) t-SNE plot of tnR-values as in Figure 1C for all proteins identified (and quantified) by MS-analysis in two independent pull-downs using purified Noe1 protein as a bait and CL-91 solubilized membrane fractions from whole mouse brain as source. Color-coding as in (A), all specific extracellular interactors are shown by squares in purple.
Figure 5
Figure 5. Effect of deletion of the network constituent Brorin.
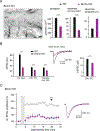
(A) Electron micrograph illustrating distribution (left panel, scale bar is 200 nm) and bar graphs denoting either relative contribution of GluA-free synapses or surface densities (right panels, mean ± SD of 23 GluA-positive synapses and 27 dendrites for Brorin KO, WT data added from Figure 2C; p-values < 0.001 for both sites, Student’s T-test)) of immuno-particles for GluA1-4 (6 nm gold-particles) determined on the plasma membrane of dendritic shafts (den) and spines (s) of CA1 PCs in hippocampi of WT and Brorin KO mice. (B) Bar graphs summarizing the amplitudes of AMPAR-mediated sEPSCs or mEPSCs determined as in Figure 3A in the indicated types of hippocampal neurons in WT (added from Figure 2C) and Brorin KO mice. Data for sEPSCs are mean ± SEM of 5 hilar INs, 27 CA1 PCs, 3 DGs (p-values < 0.01 denoted by three asterisks, Mann-Whitney U-test), data for mEPSCs are mean ± SEM of 5 WT and Brorin KO neurons (p-values < 0.01, Mann-Whitney U-test). mEPSCs occurred at frequencies of (mean ± SEM) 1.7 ± 0.3, not significantly different from WT. Inset: Representative sEPSCs from hilar interneurons; time and current scaling as indicated. (C) LTP-experiment as in Figure 3 performed in CA1 PCs of Brorin KO animals. Data are mean ± SEM of 14 WT (from Figure 3B, open circles) and 6 Brorin KO neurons (p < 0.01 for EPSCs marked with the arrowhead; Mann-Whitney U-test). Inset: Representative EPSCs recorded before (gray) and 20 min after LTP-induction (purple traces); current and time scaling as indicated. Note profound alterations in AMPAR-distribution, sEPSC amplitudes and LTP induction by knockout of Brorin.
Figure 6
Figure 6. Working model for AMPAR-anchoring by Noelin-based extracellular networks.
Scheme illustrating the results derived here for the hypothetical molecular appearance and operation of the Noelin-associated protein networks for clustering and anchoring of surface AMPARs in synapses and dendrites. The selected network constituents given on the right are drawn about to scale using data from literature and databases, as well as structural predictions/conclusions from AlphaFold . Sites and structural details of interactions were not intended. Most of the newly identified Noe interactors escaped detection in our previous anti-GluA APs for technical reasons (stability of 3rd-line interactors of AP-target). Inset depicts the alterations induced by removal of Noe1-3 leaving accumulation/localization of synaptic AMPARs to interactions with the PSD depicted as a sub-membraneous layer.

Similar articles

Cited by

References

    1. Collingridge GL, Peineau S, Howland JG, and Wang YT (2010). Long-term depression in the CNS. Nat Rev Neurosci 11, 459–473. DOI: 10.1038/nrn2867. - DOI - PubMed
    1. Cull-Candy S, Kelly L, and Farrant M (2006). Regulation of Ca2+-permeable AMPA receptors: synaptic plasticity and beyond. Curr Opin Neurobiol 16, 288–297. DOI: 10.1016/j.conb.2006.05.012. - DOI - PubMed
    1. Greger IH, Watson JF, and Cull-Candy SG (2017). Structural and Functional Architecture of AMPA-Type Glutamate Receptors and Their Auxiliary Proteins. Neuron 94, 713–730. DOI:10.1016/j.neuron.2017.04.009. - DOI - PubMed
    1. Traynelis SF, Wollmuth LP, McBain CJ, Menniti FS, Vance KM, Ogden KK, Hansen KB, Yuan H, Myers SJ, and Dingledine R (2010). Glutamate receptor ion channels: structure, regulation, and function. Pharmacol Rev 62, 405–496. DOI: 10.1124/pr.109.002451. - DOI - PMC - PubMed
    1. Herguedas B, Watson JF, Ho H, Cais O, Garcia-Nafria J, and Greger IH (2019). Architecture of the heteromeric GluA1/2 AMPA receptor in complex with the auxiliary subunit TARP gamma8. Science 364. DOI: 10.1126/science.aav9011. - DOI - PMC - PubMed

Publication types

Substances

LinkOut - more resources