[Preprint]. 2023 Jan 24:2023.01.24.525203.
doi: 10.1101/2023.01.24.525203.

Multimodal characterization of antigen-specific CD8 + T cells across SARS-CoV-2 vaccination and infection

Affiliations

Multimodal characterization of antigen-specific CD8 + T cells across SARS-CoV-2 vaccination and infection

Bingjie Zhang et al. bioRxiv. .

Update in

Abstract

The human immune response to SARS-CoV-2 antigen after infection or vaccination is defined by the durable production of antibodies and T cells. Population-based monitoring typically focuses on antibody titer, but there is a need for improved characterization and quantification of T cell responses. Here, we utilize multimodal sequencing technologies to perform a longitudinal analysis of circulating human leukocytes collected before and after BNT162b2 immunization. Our data reveal distinct subpopulations of CD8 + T cells which reliably appear 28 days after prime vaccination (7 days post boost). Using a suite of cross-modality integration tools, we define their transcriptome, accessible chromatin landscape, and immunophenotype, and identify unique biomarkers within each modality. By leveraging DNA-oligo-tagged peptide-MHC multimers and T cell receptor sequencing, we demonstrate that this vaccine-induced population is SARS-CoV-2 antigen-specific and capable of rapid clonal expansion. Moreover, we also identify these CD8 + populations in scRNA-seq datasets from COVID-19 patients and find that their relative frequency and differentiation outcomes are predictive of subsequent clinical outcomes. Our work contributes to our understanding of T cell immunity, and highlights the potential for integrative and multimodal analysis to characterize rare cell populations.


Conflict of interest statement

Competing interests:

In the past three years, R.S. has worked as a consultant for Bristol-Myers Squibb, Regeneron, and Kallyope and served as an SAB member for ImmunAI, Resolve Biosciences, Nanostring, and the NYC Pandemic Response Lab. D.R.L. is cofounder of Vedanta Biosciences and ImmunAI, on the advisory boards of IMIDomics and Evommune, and on the board of directors of Pfizer. MJM reported potential competing interests: laboratory research and clinical trials contracts with Lilly, Pfizer (exclusive of the current work), and Sanofi for vaccines or MAB vs SARS-CoV-2; contract funding from USG/HHS/BARDA for research specimen characterization and repository; research grant funding from USG/HHS/NIH for SARS-CoV-2 vaccine and MAB clinical trials; personal fees from Meissa Vaccines, Inc. and Pfizer for Scientific Advisory Board service. RSH has received research support from CareDx for SARS-CoV-2 vaccine studies. RSH is a consultant for Bristol-Myers-Squibb. All other authors declare no competing interests.

Figures
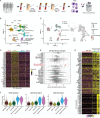
Figure 1:
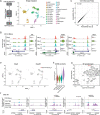
Figure 1:. Multimodal identification of SARS-CoV-2 mRNA vaccine-induced CD8+ T cells.
(A) Overview of human biospecimen study design. (B) Uniform manifold approximation and projection (UMAP) visualizations of 113,897 single cells profiled with CITE-seq and clustered by a weighted combination of RNA and protein modalities. Cells are colored based on level-2 annotation ( level-1 and level-3 annotations are shown in Supplementary Figure 1A). (C) Single-cell heatmap showing activation of interferon response module within CD14 monocytes. (D) Milo analysis of differentially abundant cell states between Day 0 and Day 28 samples. UMAP on the left is color coded by time point. Right plot indicates embedding of the Milo differential abundance. Each node represents a neighborhood, node size is proportional to the number of cells, and neighborhoods are colored by the level of differential abundance. (E) Beeswarm plot showing the log-fold distribution of cell abundance changes. Neighborhoods overlapping the same cell population are grouped together, neighborhoods exhibiting differential abundance are colored in red. (F) Violin plots with protein upregulation of CD38, HLA-DR and CD278 (ICOS) in vaccine-induced cells compared with other selected CD8 T cells. (G) Heatmap showing mRNA expression of 50 marker genes for vaccine-induced group A cells, as well as cell cycling genes highly expressed in vaccine-induced group B cells. For visualization purposes, a randomly selected subset of CD8+ TEM are presented.
Figure 2:
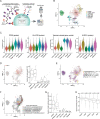
Figure 2:. Celltype-specific chromatin accessibility dynamics in response to vaccination.
(A) Bridge integration-based mapping of human PBMC scATAC-seq data onto the CITE-seq dataset from Figure 1B, using a multi-omic dataset as a bridge. Cells are colored by reference-derived annotation. (B) Coverage plots indicating chromatin accessibility around IFI6, IFITM3, and ISG15 in CD14 monocytes across all time points. Corresponding gene expression for each cell population, from the CITE-seq dataset, is shown on the right. (C) Scatter plot measuring correlation between Day 0 and Day 2 pseudo-bulk chromatin accessibility of CD14 monocytes. Each point corresponds to a called scATAC-seq peak. (D) UMAP visualization of scATAC-seq data on Day 0 and Day 28 after bridge integration. Vaccine-induced populations are highlighted in red. (E) CD38 protein expression levels, which were not considered during the bridge integration procedure, are correctly up-regulated in cells predicted to be vaccine-induced. (F) Examples of enhancer loci that are specifically accessible in vaccine-induced cells. Chromatin accessibility patterns on Day 28 are shown for four selected cell types. SNP sites are annotated as yellow lines. (G) Motif-based overrepresentation analysis of transcription factor binding sites in the top 1000 peaks with differentially enriched accessibility in the vaccine-induced group A cells.
Figure 3:
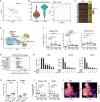
Figure 3:. Antigen-specific clonal expansion of vaccine-induced CD8+ T cells
(A) Schematic of ECCITE-seq experimental design. (B) UMAP visualizations of 31,396 single cells profiled with ECCITE-seq and clustered based on weighted combination of RNA, protein and T-cell receptor information. (C) Violin plots for CD38, HLA-DR and KLRG1 protein levels, and the expression of identified vaccine-induced gene module. (D) Left: UMAP visualization from (B), dextramer-positive (Dex+) cells are highlighted in red. Right: The fraction of cells harboring spike-specific TCR in each cluster. A TCR clone is considered spike-specific when at least one cell of the clone is Dex+. Boxplot shows variation across n=10 samples. (E) UMAP visualization from (B), cells are colored by the expansion index of their associated clonotype based on TCR sequence information. (F) UMAP visualization from (B), cells representing the six most abundant spike-specific clones are highlighted.(G) Boxplots showing the fraction of cells harboring TCR matching SARS-CoV-2 spike antigens in public databases. (H) Boxplots showing the single-cell expression of the vaccine-induced gene module in antigen-specific cells. Cells are grouped by labels in (E).
Figure 4:
Figure 4:. Inferred spike-specific T cells in SARS-CoV-2 infected samples
(A) UMAP visualization from (Adamo et al.), representing 6,070 CD8+ T cells collected during acute COVID-19 disease. Cells with positive dextramer staining are highlighted in red. (B) Left: Violin plots showing distribution of gene module score, comparing dextramer-positive versus -negative cells. Right: ROC curve assessing the ability of the gene module score to correctly predict dextramer staining labels in single cells. (C) The vaccine-induced gene expression module is conserved in SARS-CoV-2 infected samples. Shown is the expression of the top 50 vaccine-induced marker genes for dextramer-positive and -negative cells. For visualization purposes, a randomly selected subset of dextramer-negative cells are presented. (D) WNN UMAP visualization of 65,889 single cells from the COMBAT dataset. WNN was performed based on RNA and protein modalities, and identifies cell populations that we infer are specific to SARS-CoV-2 antigens. (E) Milo analysis of differential abundance changes, comparing healthy versus SARS-CoV-2 infected groups, as in Figure 1 D-E. (F) Amongst all CD8+ T cells, donor fraction of antigen, antigen_proflif, and CD38+KLRG1+ cells, grouped by disease state. Boxplots show variation across n=71 donors, and p-values from two-tailed Wilcoxon signed-rank test. (G) The fraction of inferred antigen-specific cells correlates with clinical outcome. Same as in (F), but restricted to patients exhibiting severe symptoms, and grouped by their clinical outcome. (H) UpSet plot visualizing the overlap of antigen-specific TCR sequences across distinct molecular states of CD8+ T cells. (I) Fraction of TCR clonotypes identified in either antigen cells (right) or antigen_prolif cells (left) that are also observed in Cytotoxic TEM cells. Boxplots show variation across diseased donors. (J) Density plots showing the abundance distribution of all cells harboring expanded antigen-specific TCR sequences.

Similar articles

References

    1. Polack F. P. et al. Safety and Efficacy of the BNT162b2 mRNA Covid-19 Vaccine. N. Engl. J. Med. 383, 2603–2615 (2020). - PMC - PubMed
    1. Walter E. B. et al. Evaluation of the BNT162b2 Covid-19 Vaccine in Children 5 to 11 Years of Age. N. Engl. J. Med. 386, 35–46 (2022). - PMC - PubMed
    1. Magen O. et al. Fourth Dose of BNT162b2 mRNA Covid-19 Vaccine in a Nationwide Setting. N. Engl. J. Med. 386, 1603–1614 (2022). - PMC - PubMed
    1. Walsh E. E. et al. Safety and Immunogenicity of Two RNA-Based Covid-19 Vaccine Candidates. N. Engl. J. Med. 383, 2439–2450 (2020). - PMC - PubMed
    1. Sahin U. et al. COVID-19 vaccine BNT162b1 elicits human antibody and TH1 T cell responses. Nature 586, 594–599 (2020). - PubMed

Publication types