. 2023 Jan 5;186(1):209-229.e26.
doi: 10.1016/j.cell.2022.11.026.

A transcription factor atlas of directed differentiation

Affiliations

A transcription factor atlas of directed differentiation

Julia Joung et al. Cell. .

Erratum in

  • A transcription factor atlas of directed differentiation.
    Joung J, Ma S, Tay T, Geiger-Schuller KR, Kirchgatterer PC, Verdine VK, Guo B, Arias-Garcia MA, Allen WE, Singh A, Kuksenko O, Abudayyeh OO, Gootenberg JS, Fu Z, Macrae RK, Buenrostro JD, Regev A, Zhang F. Joung J, et al. Cell. 2024 Jun 6;187(12):3161. doi: 10.1016/j.cell.2024.04.038. Epub 2024 May 2. Cell. 2024. PMID: 38697106 No abstract available.

Abstract

Transcription factors (TFs) regulate gene programs, thereby controlling diverse cellular processes and cell states. To comprehensively understand TFs and the programs they control, we created a barcoded library of all annotated human TF splice isoforms (>3,500) and applied it to build a TF Atlas charting expression profiles of human embryonic stem cells (hESCs) overexpressing each TF at single-cell resolution. We mapped TF-induced expression profiles to reference cell types and validated candidate TFs for generation of diverse cell types, spanning all three germ layers and trophoblasts. Targeted screens with subsets of the library allowed us to create a tailored cellular disease model and integrate mRNA expression and chromatin accessibility data to identify downstream regulators. Finally, we characterized the effects of combinatorial TF overexpression by developing and validating a strategy for predicting combinations of TFs that produce target expression profiles matching reference cell types to accelerate cellular engineering efforts.

Keywords: ORF overexpression; cell engineering; cellular disease modeling; combinatorial perturbation; gene regulation; genetic screening; neural progenitor; pluripotent stem cell; single cell profiling; transcription factor.


Conflict of interest statement

Declaration of interests J.J. and F.Z. are inventors listed on an International PCT Application related to this work. F.Z. is a scientific advisor and co-founder of Editas Medicine, Beam Therapeutics, Pairwise Plants, Arbor Biotechnologies, and Proof Diagnostics. F.Z. is a scientific advisor for Octant. A.R. is a co-founder and equity holder of Celsius Therapeutics, an equity holder in Immunitas, and was an SAB member of ThermoFisher Scientific, Syros Pharmaceuticals, Neogene Therapeutics, and Asimov until 31 July 2020. Since 1 August 2020, A.R. has been an employee of Genentech and has equity in Roche. A.R. is an inventor on patents and patent applications filed at the Board related to single-cell genomics. J.D.B. holds patents related to ATAC-seq and scATAC-seq and serves on the scientific advisory boards of CAMP4 Therapeutics, seqWell, and CelSee. J.S.G. and O.O.A. are cofounders of Sherlock Biosciences, Proof Diagnostics, Moment Biosciences, and Tome Biosciences. Since 16 November 2020, K.R.G.-S. has been an employee of Genentech.

Figures
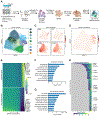
Figure 1 ∣
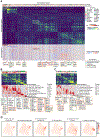
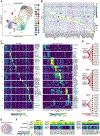
Figure 1 ∣. Building a TF Atlas of directed differentiation.
(A) Schematic of TF Atlas setup. MOI, multiplicity of infection. (B-D) Uniform manifold approximation and projection (UMAP) of scRNA-seq data from 671,453 cells overexpressing 3,266 TF isoforms. Colors indicate Louvain clusters (B), gene expression (C), and diffusion pseudotime (D). (E) Smoothened heatmap of the top 1,000 upregulated and downregulated genes over diffusion pseudotime. Genes are ordered by change over pseudotime. (F,G) Most enriched pathways among the top 100 upregulated (F) and downregulated (G) genes. (H) Heatmap showing the significance of the pseudotime difference between cells expressing each TF isoform and those expressing controls. Only 320 TF genes with multiple isoforms, at least one of which is significant, are included. See also Figures S1 and S2.
Figure 2 ∣
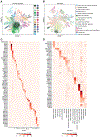
Figure 2 ∣. Unbiased grouping of TFs based on gene programs.
(A) Heatmaps showing pairwise Pearson correlation (top) and enrichment of 100 gene programs (bottom) identified using non-negative matrix factorization (NMF) on mean expression profiles of 3,266 TF ORFs. TFs are ordered by hierarchical clustering. Relations between some groups of TFs are annotated. Numbers in parentheses indicate the number of TF isoforms in the same group. (B,C) Zoomed in subsets of (A) with top enriched pathway for each gene program. (D) UMAP of TF Atlas scRNA-seq data highlighting enrichment of each gene program.
Figure 3 ∣
Figure 3 ∣. Mapping TF ORFs in differentiated cells to reference cell types.
(A,B) UMAP of scRNA-seq data from 28,825 differentiated cells (clusters 6-8 in Figure 1B). Colors indicate Louvain clusters (A) and nominated reference cell types (Cao Science 2020) with score >0.3 (B). (C,D) Heatmaps showing percentage of cells with the indicated TF ORF for each cluster (C) or nominated cell type (D). Numbers after TF gene names indicate the isoform. Percentages are normalized to the total number of cells with the indicated TF ORF in the TF Atlas. For each cluster, only the 5 most enriched TF ORFs >5% are shown. EMT, epithelial-mesenchymal transition; ENS, enteric nervous system. See also Figure S3.
Figure 4 ∣
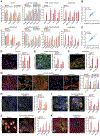
Figure 4 ∣. Validation of candidate TFs for differentiation towards nominated cell types.
(A) Expression of marker genes for each cell type measured by quantitative PCR in H1 hESCs after 7 days of TF ORF or GFP overexpression. Numbers after TF gene names indicate the isoform. N = 4. (B,C) Scatterplot comparing expression of all marker genes (205 from Figure 4A and Figure S3L,M) in H1 hESCs to H9 hESCs (B) or 11a iPSCs (C). Expression is measured relative to GFP control. (D-K) Left, expression of marker genes measured by immunostaining in H1 hESCs after 7 days of TF ORF overexpression. Right, intensity of marker gene staining normalized to GFP control from n = 6 images. Scale bar, 25 μm. Marker genes for neuron (D), EMT smooth muscle (E), endothelial (F), smooth muscle (G), metanephric (H), intestinal epithelial (I), lung ciliated epithelial (J), and trophoblast (K) cells are shown. EMT, epithelial-mesenchymal transition. Immunostaining controls are shown in Data S11C. Values represent mean ± SEM. ****P < 0.0001; ***P < 0.001; **P < 0.01; *P < 0.05. See also Figure S3.
Figure 5 ∣
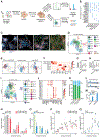
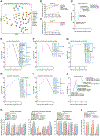
Figure 5 ∣. Targeted TF overexpression screening platform for directed differentiation.
(A) Schematic of targeted TF screening. MOI, multiplicity of infection. (B) Comparison of TF ranks from 5 iNP differentiation screens. (C) Expression of markers for neurons (MAP2), astrocytes (GFAP), and oligodendrocyte precursor cells (PDGFRA) after spontaneous differentiation from RFX4-iNPs. Scale bar, 100 μm. (D-H) ScRNA-seq profiling of iNPs differentiated using different methods. EB, embryoid body; DS, dual SMAD; NP, neural progenitors; CN, CNS neurons; CNC, cranial neural crest. Data represents n = 2 batch replicates with 15,211 RFX4-DS, 11,148 EB, and 16,421 DS. (D,E) UMAP of scRNA-seq data with colors indicating Louvain clusters (D) or batch replicates (E). (F) Heatmap showing the percentage of cells from each replicate in each cluster. (G,H) Box plots showing intra- (G) or inter- (H) batch Euclidean distances between cells. Whiskers indicate the 5th and 95th percentiles. (I-K) ScRNA-seq data from 26,111 cells spontaneously differentiated from RFX4-DS-iNPs for 4 or 8 weeks. Data represents n = 2 biological replicates. RG, radial glia; CN, CNS neurons; MNG, meninges; P, proliferating cells. (I) UMAP with colors indicating Louvain clusters. (J) Dot plot showing marker genes for each cluster. Circle size and color indicate percentage and expression level, respectively. (K) Distribution of cell types produced by each replicate. (L) RFX4 ChIP-seq reads at NR2F1 and NR2F2 promoter regions. (M) Expression of NR2F1 and NR2F2 measured by bulk RNA-seq after 7 days of RFX4 or GFP overexpression. (N-Q) Modeling effects of DYRK1A perturbation in RFX4-iNPs derived from 11a iPSCs. (N,O) Percentage of EdU labeled cells after spontaneous differentiation for DYRK1A knockout (N) or overexpression (O). N = 3. (P,Q) Intensity of MAP2 staining for neurons after spontaneous differentiation for DYRK1A knockout (P) or overexpression (Q). N = 12 images. Values represent mean ± SEM. KO, knockout; NT, non-targeting; sg, single guide RNA. ****P < 0.0001; ***P < 0.001; **P < 0.01; *P < 0.05; ns, not significant. See also Figures S4 and S5.
Figure 6 ∣
Figure 6 ∣. Discovery of TF regulatory networks by joint profiling of chromatin accessibility and expression.
(A) Weighted nearest neighbor (WNN) UMAP of joint chromatin accessibility and expression profiles from 69,085 cells overexpressing 198 TFs for 4 or 7 days. Colors indicate smart local moving (SLM) clusters. (B) Dot plot showing marker genes for each cluster. Color and circle size indicate expression level and chromatin accessibility, respectively, relative to other clusters. (C) Heatmaps showing gene regulatory networks (GRN) containing the top TF ORFs (left) and nominated downstream TFs (right) for each cluster. Left, percentage of cells with the indicated TF ORF. Numbers after TF gene names indicate the isoform. Percentages are normalized to the total number of cells with the TF ORF. Only the 6 most enriched TF ORFs >5% are shown for each cluster. Right, average area under the ROC curve (AUC) of TF motif enrichment and RNA expression is shown for significantly enriched (FDR < 0.05) TFs. TFs that were identified as top ORFs and downstream TFs are labeled in blue. (D) Examples of GRNs identified by matching the top TF ORFs (left) with nominated downstream TFs (right). Color of arrows indicates chromatin accessibility of the downstream TF promoter region relative to cluster 0. (E) Schematic showing the relation between differentially expressed genes (DEGs) induced by upstream and downstream TFs. (F) Heatmaps showing the percentage of downstream TF DEGs included in upstream TF DEGs using TFs in each row as upstream (top) or downstream (bottom) relative to TFs in each column. See also Figure S6.
Figure 7 ∣
Figure 7 ∣. Combinatorial TF screening and prediction.
(A) UMAP of scRNA-seq profiles from the combinatorial screen of 10 TF ORFs in combinations, including 44 doubles and 3 triples, as well as 10 singles. Each circle represents the mean expression profile of cells with the indicated TF ORF(s). (B,C) Percent accuracy for different approaches to predict TFs for measured double (B) or triple (C) TF expression profiles. (D-I) Cell type prediction results for double TF profiles. Known combinations (D) or predicted combinations for hepatoblasts (E), bronchiolar and alveolar epithelial cells (F), metanephric cells (G), vascular endothelial cells (H), and trophoblast giant cells (I) are shown. As gene signature scores were discrete, the percentile ranks were reported as ranges. TFs that are part of known combinations, developmentally critical, or specifically expressed in the target cell types are indicated in blue. (J) Prediction results for known combinations of triple TF profiles. To expand the number of combinations, parts of known combinations with >3 TFs were included. (K,L) Marker gene expression for each cell type measured by quantitative PCR (K; n = 4) or immunostaining (L; n = 6 images) after 7 days of TF ORF or control overexpression. Numbers after TF gene names indicate the isoform. Intensity is normalized to GFP control. Values represent mean ± SEM. ****P < 0.0001; ***P < 0.001; **P < 0.01; *P < 0.05; ND, not detected. See also Figure S7.

Similar articles

Cited by

References

    1. Aibar S, Gonzalez-Blas CB, Moerman T, Huynh-Thu VA, Imrichova H, Hulselmans G, Rambow F, Marine JC, Geurts P, Aerts J, et al. (2017). SCENIC: single-cell regulatory network inference and clustering. Nat Methods 14, 1083–1086. 10.1038/nmeth.4463. - DOI - PMC - PubMed
    1. Amit I, Garber M, Chevrier N, Leite AP, Donner Y, Eisenhaure T, Guttman M, Grenier JK, Li W, Zuk O, et al. (2009). Unbiased reconstruction of a mammalian transcriptional network mediating pathogen responses. Science 326, 257–263. 10.1126/science.1179050. - DOI - PMC - PubMed
    1. Barnes RM, Firulli BA, Conway SJ, Vincentz JW, and Firulli AB (2010). Analysis of the Hand1 cell lineage reveals novel contributions to cardiovascular, neural crest, extra-embryonic, and lateral mesoderm derivatives. Dev Dyn 239, 3086–3097. 10.1002/dvdy.22428. - DOI - PMC - PubMed
    1. Basu P, Morris PE, Haar JL, Wani MA, Lingrel JB, Gaensler KM, and Lloyd JA (2005). KLF2 is essential for primitive erythropoiesis and regulates the human and murine embryonic beta-like globin genes in vivo. Blood 106, 2566–2571. 10.1182/blood-2005-02-0674. - DOI - PMC - PubMed
    1. Bergen V, Lange M, Peidli S, Wolf FA, and Theis FJ (2020). Generalizing RNA velocity to transient cell states through dynamical modeling. Nat Biotechnol 38, 1408–1414. 10.1038/s41587-020-0591-3. - DOI - PubMed

Publication types