. 2022 Nov;19(11):1393-1402.
doi: 10.1038/s41592-022-01604-1. Epub 2022 Oct 10.

Light-Seq: light-directed in situ barcoding of biomolecules in fixed cells and tissues for spatially indexed sequencing

Affiliations

Light-Seq: light-directed in situ barcoding of biomolecules in fixed cells and tissues for spatially indexed sequencing

Jocelyn Y Kishi et al. Nat Methods. 2022 Nov.

Abstract

We present Light-Seq, an approach for multiplexed spatial indexing of intact biological samples using light-directed DNA barcoding in fixed cells and tissues followed by ex situ sequencing. Light-Seq combines spatially targeted, rapid photocrosslinking of DNA barcodes onto complementary DNAs in situ with a one-step DNA stitching reaction to create pooled, spatially indexed sequencing libraries. This light-directed barcoding enables in situ selection of multiple cell populations in intact fixed tissue samples for full-transcriptome sequencing based on location, morphology or protein stains, without cellular dissociation. Applying Light-Seq to mouse retinal sections, we recovered thousands of differentially enriched transcripts from three cellular layers and discovered biomarkers for a very rare neuronal subtype, dopaminergic amacrine cells, from only four to eight individual cells per section. Light-Seq provides an accessible workflow to combine in situ imaging and protein staining with next generation sequencing of the same cells, leaving the sample intact for further analysis post-sequencing.


Conflict of interest statement

J.Y.K., N.L., P.Y. and S.K.S. are inventors on patent applications covering the method. Multiple authors are involved in commercialization of the technique and engage with Digital Biology, Inc. (J.Y.K. and E.R.W. are co-founders and employees; P.Y. is co-founder, equity holder, director and consultant; S.K.S. is anticipated to be a consulting scientific co-founder; N.L. is a consulting founding scientist; J.J.J. is an employee.) P.Y. is also a co-founder, equity holder, director and consultant of Ultivue, Inc. The remaining authors declare no competing interests.

Figures

Fig. 1
Fig. 1. Light-Seq overview.
Light-Seq enables selective barcoding of custom selected cells or tissue regions in situ for transcriptomic sequencing. Step (1): Target ROIs can be selected based on phenotypic factors including spatial location, morphology or protein biomarkers in automated or manual fashion after imaging. Custom selection allows large or small regions, and contiguous or disjointed cell groups to be flexibly labeled by photocrosslinking of DNA barcodes, which are then converted into sequenceable indices. For multiplexed targeting of different cell groups or regions, the process can be iterated using different barcode sets. Step (2): After light-directed labeling, barcoded cDNAs are released and prepared into pooled sequencing libraries which are read by standard NGS platforms. The obtained profiles can be analyzed to identify differentially expressed genes. Optionally, the same sample can be revisited after sequencing to perform follow-up assays, such as high-resolution imaging, morphology or protein labeling.
Fig. 2
Fig. 2. Light-controlled DNA photocrosslinking.
a, Schematic for light-directed barcode attachment on glass slides. Biotinylated single-stranded DNA oligos are immobilized onto glass surfaces with biotin–streptavidin binding. Fluorescent barcode strands containing a CNVK moiety in the complementary domain are hybridized to these immobilized oligos. Target pixels corresponding to ROIs in the field of view are UV-illuminated in a parallelized fashion using a DMD to photocrosslink the barcodes in a photomask pattern. Uncrosslinked strands are removed by stringent washes, which reveals the encoded barcode pattern in fluorescence. b, Custom patterning (right) achieved by using a cat photo (left) to create a binary photomask and photocrosslinking the fluorescent CNVK-containing barcode strands onto a functionalized glass slide. c, Iterative photocrosslinking using three photomasks (left) that define three ROIs to attach three orthogonal barcode strands onto a DNA-coated glass slide, forming a Penrose triangle (right).
Fig. 3
Fig. 3. Cross-junction synthesis and full in situ protocol with validation on cell mixtures.
a, Design of the cross-junction synthesis reaction. First, a primer extends the new strand until the stopper (step 1). Next, the extended primer P domain competes with the identical P domain on the opposite template through branch migration, similar to our previously developed Primer Exchange Reaction (PER) (step 2). Once displaced, the synthesized P domain (blue) primer can bind across to form a three-way junction and then continue to be extended (step 3). The P domain is typically 7 nt, which may become 8 nt if the Bst polymerase A-tails. b, The Light-Seq workflow for in situ transcriptomic sequencing: (1) RT is performed with random primers containing a 5′ barcode dock site, followed by A-tailing of 3′ cDNA ends. (2) Within each ROI, a unique CNVK-modified DNA barcode strand is UV-crosslinked to the 5′ cDNA dock site. (3) Barcoded cDNAs are extracted using RNase H, which cleaves RNA in RNA–DNA hybrids. (4) The cross-junction synthesis reaction copies the barcode and cDNA sequences into a single strand for (5) PCR amplification and (6) sequencing library preparation and NGS. c, Cell mixing tests: eGFP-expressing HEK293 and mouse 3T3 cells were co-cultured and fixed, and cDNAs were labeled with Barcodes 1 and 2, respectively. d, A subset of ~25 3T3 (cyan) and ~25 HEK cells (magenta) were barcoded in the whole well of an 18-well chambered coverslip (rectangular area with the dashed line on the schematic marks the size of the stitched image shown in this panel with respect to the area of the whole well), each containing ~4,500 total cells (n = 3 technical replicates, representative image shown). All cells were stained with DAPI (yellow) after barcoding. e, Brightfield and GFP fluorescence overlaid with ROIs for labeling with Barcodes 1 and 2 (field-of-view is magnification of panel d, white square). f, Fluorescent image for panel e after photocrosslinking Barcodes 1 (magenta) and 2 (cyan). g, Portions of reads that mapped to human, mouse or eGFP sequences in a merged human and mouse reference genome, which were respectively labeled with Barcode 1 or 2 (n = 3 technical replicates). h, After barcoded sequence extraction, the same cells (white square from panel f) were stained by IF for Lamin-B (yellow), tubulin (violet) and TFAM (red, human epitope-specific).
Fig. 4
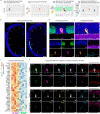
Fig. 4. Application of Light-Seq for spatial barcoding of three main retinal layers in fixed frozen mouse retina sections.
a, Three regions of the mouse retina were uniquely barcoded: the ONL with Barcode 1, the BCL with Barcode 2 and the GCL with Barcode 3. b, After barcoding, fluorescently labeled barcode strands were detected in the targeted cell layers: ONL (magenta, Barcode 1; 1,112 ± 199 cells, n = 4 sections), BCL (cyan, Barcode 2; 298 ± 29 cells, n = 4 sections) and GCL (green, Barcode 3; 91 ± 14 cells, n = 4 sections). c, Volcano plots of differentially expressed genes between the ONL and BCL (top), ONL and GCL (middle) and BCL and GCL (bottom), with select markers labeled. The x and y axes show the log2(fold change) and the log10(P value), respectively. d, Heatmap of z-scores for differentially expressed genes with enrichment in just one layer (Padj < 0.05; see source data; two-sided Wald test with Benjamini–Hochberg adjustment for multiple hypothesis testing). e, Boxplot of estimated sensitivity of Light-Seq (n = 4 replicates, 16 genes) and Drop-Seq (n = 6 replicates, 16 genes) compared with smFISH data for bipolar subtype marker genes with measured abundances based on quantitative smFISH. Sensitivity is defined as (number of expected transcripts by smFISH)/(number of observed reads by Light-Seq or Drop-Seq). Midline marks the median and edges indicate the 25th and 75th percentiles. Whiskers extend to encompass all data not considered outliers (default threshold in MATLAB boxplot function; maximum whisker length is 1.5 × interquartile range). Dot color corresponds to replicate number. f, DAPI, WGA staining and IF for VSX2 and PAX6 proteins were performed on the same tissue section after extraction of barcoded cDNAs. Scale bars are 100 μm in a, and 50 µm (left) and 200 µm (right) in b and f. Source data
Fig. 5
Fig. 5. Rare cell transcriptomics by Light-Seq.
a, Workflow for performing Light-Seq on the rare TH+ AC subtype, DACs: (1) Mouse retinas were fixed, frozen and cryosectioned. (2) After in situ RT, sections were stained with an antibody targeting the TH protein to label DACs (orange). (3) Barcoding of TH ACs with FITC-barcode strands (Bar1) and TH+ DACs with Cy3-barcode strands (Bar2) was performed in two rounds of light-directed barcoding, guided by the antibody stain. (4) After barcoding, cDNAs were displaced for sequencing, leaving the sample intact for further stains on the same cells. b, Representative image (n = 5 replicates) of one section replicate, stained with anti-TH antibody (orange) and DAPI (blue) before barcoding. For each replicate, only four to eight individual TH+ DACs were identified and their cell bodies were barcoded with Bar2 (magenta), together representing 0.01–0.02% of all cells in each section, and ~300 TH ACs were barcoded with Bar1 (green). Scale bars are 200 µm. c, Differential expression analysis revealed 36 transcripts enriched in DACs (Padj < 0.05; two-sided Wald test with Benjamini–Hochberg adjustment for multiple hypothesis testing; genes with log2(fold change) > 1 are shown; see source data) for n = 5 technical replicates. *Marker genes selected for further validation (log2(fold change) > 3 and Padj < 0.05). d, Fluorescently labeled barcodes (Bar1, Bar2) reveal the location of barcoded cDNAs, relative to the TH IF. Scale bars are 10 µm (n = 5 replicates, each with 4–8 TH+ cells per section). e, After cDNAs were displaced and sequenced, the same intact sections were stained for a membrane label (WGA) and a known marker of DACs via IF (CARTPT, cyan), in addition to the original TH IF and DAPI labels. f, Markers with log2(fold change) > 3 and Padj < 0.05 were validated using TH IF and RNA-FISH in new samples. Nondifferential controls, Gad1 and Vsx2, were also detected to demonstrate FISH labeling in TH ACs and other retinal cells. Top row shows overlay of RNA detection with TH IF, and bottom row shows single RNA-FISH channel. Scale bars are 10 µm. Representative images of n = 3–4 section replicates per marker. Source data
Extended Data Fig. 1
Extended Data Fig. 1. High resolution light-directed DNA barcoding.
(a) Fluorescent image of a dot array printed onto a glass slide functionalized with DNA docking sequences. Dots were printed through targeted photocrosslinking of fluorescent DNA barcode strands to complementary docking sites (see also Fig. 2a). Five dots were chosen for a profile scan of gray values (magenta dashes), pixel contrast set to 450–800. (b) Linescans from panel a (dotted colored lines) were averaged into a single linescan (black dots with dashes). Averaged linescan was fit to a Gaussian curve (blue). A single dot corresponds to a single activated DMD mirror, estimated to illuminate a 0.76 µm diameter area. FWHM from the fit was ~1.56 µm. (c) Subcellular labeling of 3T3 cells with a 405 nm laser on a point-scanning confocal microscope (n = 4 cells from a single field of view). The photomask used for crosslinking was scaled to the size of the fluorescent image and manually overlaid (magenta) to aid in visualization. A profile scan was performed on the rectangular area between the magenta dashed lines. (d) Intensity profile of the dotted box from panel c, data was fit to a Gaussian curve (green) with a measured FWHM of 4.4 µm. A second exponential decay was fitted to one-half of the profile scan (blue) to calculate a 84–16% criterion, the distance across which the signal drops from 84 to 16% of the maximum value. Distance of the 84–16% drop was calculated from the exponential fit to be 2.67 µm. Vertical dashed lines indicate the estimated ROI boundary from the photomask. Width of the photomask was estimated to be 4 µm. (e-g) The single field of view in panel c imaged on a confocal scanning microscope. Nuclear signal (cyan) with the ROI selection (white lines) overlaid (e), fluorescent Cy3 barcode after stringent washes of non-crosslinked strands (f), overlay with lower contrast display of nuclear signal to enable visualization of the overlapping Cy3 signal (g).
Extended Data Fig. 2
Extended Data Fig. 2. Cell segmentation and read counts of 3T3 and HEK cells.
(a) Representative segmentation results from the fluorescent signal of the mouse (top row) and human (bottom row) barcoded cells (representative from n = 3 technical replicates). Masks were used to calculate barcoded area (also see Methods and Supplementary Table 1). (b) A single ~200 million read dataset from the cell mixing experiment (magenta) was mapped to a merged genome and subsampled by fraction of reads without replacement and processed with the UMI deduplication pipeline. Average number of UMIs from 5 simulated datasets are shown (cyan). (c-d) Scatterplots and histograms of normalized expression level (log2(TPM + 1)) between the three technical replicates for cells. We only considered the genes detected across all replicates (log2(TPM + 1) cutoff of ≥1). Highlighted data points (orange) indicate top 200 genes, remaining genes are colored blue. Pearson correlation for all genes (black) and top 200 genes (orange) reported for (c) human cells and (d) mouse cells. Histograms of log2(TPM + 1) distributions (excluding top 200 genes) for each replicate are plotted on the diagonals. Full list of gene mappings and counts is provided as Source Data Table 1. Source data
Extended Data Fig. 3
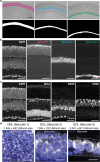
Extended Data Fig. 3. Barcoding of retinal layers.
(a) Brightfield images of a mouse retina cryosection with the barcoded area overlaid. From left to right, Outer Nuclear Layer (ONL), Bipolar Cell Layer (BCL), Ganglion Cell Layer (GCL). Scale bar is 100 µm. Binary images show the selected ROIs that were used as barcoding photomasks. Pixel size is 1.6 µm/pixel. (b) Single Z-plane spinning disc confocal images taken after barcode crosslinking for DAPI and the fluorescent barcodes 1–3 (labeled with Cy5, Cy3 and Fluorescein, respectively). (c) Single Z-plane images of DAPI, WGA, and immunofluorescence for PAX6 and VSX2 proteins in the same barcoded cells after recovery of barcoded cDNAs for sequencing. Images in (b) and (c) are displayed with auto scaling (with minimum set to zero). Scale bars are 50 µm. (d) Single Z-plane spinning disk confocal images of barcode fluorescence (white) overlaid with DAPI (blue) within each barcoded layer, displaying the different cellular morphologies with differences in cell size, cytoplasmic area, RNA density for each cellular layer that is comprised of different cell types. Scale bars are 10 µm. UMI counts per unit area (10 µm x 10 µm) are listed for each barcoded layer. Panels a-d are representative images from n = 4 technical replicates.
Extended Data Fig. 4
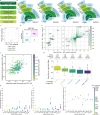
Extended Data Fig. 4. Sequencing metrics and sensitivity of Light-Seq for retinal layer experiment.
(a) Sequence processing pipeline. (b) Sunburst plots depicting fractions of reads filtered at each processing step. (c) PCA plot of Light-Seq replicates (n = 4 technical replicates per layer). (d) Correlation matrix of genes enriched in ONL versus BCL in Light-Seq and Drop-Seq data (padj < 0.05, two-sided Wald test with Benjamini-Hochberg adjustment for multiple hypothesis testing). (e) Subtraction-based enrichment of approximate difference in Light-Seq transcripts per cell between ONL and BCL to simulated difference Drop-Seq transcripts per cell between the ONL and BCL. Genes significantly enriched in either the ONL or BCL in both assays are plotted (padj < 0.05, two-sided Wald test with Benjamini-Hochberg adjustment for multiple hypothesis testing). Zoom of the plot shown on right. (f) Estimated reads per cell in Drop-Seq (simulated BCL) versus Light-Seq BCL data (barcode 2) for genes enriched in the BCL in both assays (padj < 0.05). (g) Boxplots of mean Drop-Seq (n = 6 sample replicates) vs Light-Seq (n = 4 section replicates) counts per gene per for different transcript lengths. Pearson R and median ratio shown. Median line and quartiles bound the box, with whiskers marking 1.5× the interquartile range. (h) Sensitivity of Light-Seq relative to smFISH for 16 BCL marker genes with published single-cell smFISH data. Based on the number of cells within the BCL, sensitivity calculated as [# expected transcripts by smFISH]/[# observed Light-Seq reads]. Dots represent the sensitivity of a single replicate (n = 4 replicates). Error bars show standard deviation, centered at the mean. (i) Sensitivity of Drop-Seq relative to smFISH. Based on the number of cells in the pooled bipolar clusters in Shekhar et al., 2016, sensitivity calculated as [# of expected transcripts by smFISH]/[number of observed Drop-Seq reads] (see Methods). Dots reflect sensitivity of a single replicate/gene (n = 6 sample replicates). Error bars reflect standard deviation centered around the mean. (j) Difference between mean Light-Seq and Drop-Seq sensitivity per gene from (h) and (i). Error bars show standard error for the difference of means. For panels h-j, genes are arranged and colored by ascending gene length.
Extended Data Fig. 5
Extended Data Fig. 5. Gene body coverage and gene length read distributions for retinal layers.
(a) Gene body coverage for transcripts 100 nt and up (top), 1000 nt and up (middle), 10000 nt and up (bottom). (b-c) Reads Per Kilobase of transcript, per Million mapped reads (RPKM) (panel b) and read counts (panel c) for all barcode-replicate conditions across different transcript length bins (bins based on Phipson et al., 2017). All box plots show median line and quartiles bounding the box, with whiskers marking 1.5× the interquartile range. n = 4 technical replicates.
Extended Data Fig. 6
Extended Data Fig. 6. TH+ AC ROI selection and signal.
(a) TH IF of a TH+ AC imaged on a confocal microscope with a 40× objective with barcoding ROI overlaid (magenta, left). Fluorescent image of the barcoded region (right). Pixel value set to 0–400. (b) Profile scan performed on the 50 × 5 µm rectangle across the fluorescent barcode signal (dotted box in panel a). Dashed vertical lines indicate ROI boundary. (c) Selected images of single TH+ amacrine cells stained with IF (top), with the ROIs overlaid (magenta, bottom). ROIs were drawn slightly inside the cell bodies to account for light-scattering at the ROI boundary. Scale bars are 10 µm. Panels (a) and (c) are representative images from n = 5 technical replicates. (d) A single sequencing run depth at 3.7 million read depth from a representative experimental condition was selected for subsampling without replacement illustrating UMI scaling by fraction of reads for the genes Th, Cartpt, and total UMIs. Mean + /- standard deviation of 5 simulations (cyan) are plotted, with full dataset represented as a single point (magenta).
Extended Data Fig. 7
Extended Data Fig. 7. Gene body coverage and gene length read distributions for amacrine cell experiment.
(a) Gene body coverage for transcripts 100 nt and up (left), 1000 nt and up (middle), 10000 nt and up (right). (b-c) Reads Per Kilobase of transcript, per Million mapped reads (RPKM) (in b) and read counts (in c) for all barcode-replicate conditions across different transcript length bins. All box plots show median line and quartiles bounding the box, with whiskers marking 1.5× the interquartile range. n = 5 technical replicates.

Similar articles

Cited by

References

    1. Altemose N, et al. μDamID: a microfluidic approach for joint imaging and sequencing of protein-DNA interactions in single cells. Cell Syst. 2020;11:354–366.e9. - PMC - PubMed
    1. Zhang JQ, et al. Linked optical and gene expression profiling of single cells at high-throughput. Genome Biol. 2020;21:49. - PMC - PubMed
    1. Nitta N, et al. Intelligent image-activated cell sorting. Cell. 2018;175:266–276.e13. - PubMed
    1. Schraivogel D, et al. High-speed fluorescence image-enabled cell sorting. Science. 2022;375:315–320. - PMC - PubMed
    1. Hasle N, et al. High-throughput, microscope-based sorting to dissect cellular heterogeneity. Mol. Syst. Biol. 2020;16:e9442. - PMC - PubMed

Publication types