Polyphony: an Interactive Transfer Learning Framework for Single-Cell Data Analysis
- PMID: 36155452
- PMCID: PMC10039961
- DOI: 10.1109/TVCG.2022.3209408
Polyphony: an Interactive Transfer Learning Framework for Single-Cell Data Analysis
Abstract
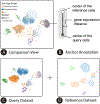
Reference-based cell-type annotation can significantly reduce time and effort in single-cell analysis by transferring labels from a previously-annotated dataset to a new dataset. However, label transfer by end-to-end computational methods is challenging due to the entanglement of technical (e.g., from different sequencing batches or techniques) and biological (e.g., from different cellular microenvironments) variations, only the first of which must be removed. To address this issue, we propose Polyphony, an interactive transfer learning (ITL) framework, to complement biologists' knowledge with advanced computational methods. Polyphony is motivated and guided by domain experts' needs for a controllable, interactive, and algorithm-assisted annotation process, identified through interviews with seven biologists. We introduce anchors, i.e., analogous cell populations across datasets, as a paradigm to explain the computational process and collect user feedback for model improvement. We further design a set of visualizations and interactions to empower users to add, delete, or modify anchors, resulting in refined cell type annotations. The effectiveness of this approach is demonstrated through quantitative experiments, two hypothetical use cases, and interviews with two biologists. The results show that our anchor-based ITL method takes advantage of both human and machine intelligence in annotating massive single-cell datasets.
Figures


Similar articles
-
scGAD: a new task and end-to-end framework for generalized cell type annotation and discovery.Brief Bioinform. 2023 Mar 19;24(2):bbad045. doi: 10.1093/bib/bbad045. Brief Bioinform. 2023. PMID: 36869836
-
scBOL: a universal cell type identification framework for single-cell and spatial transcriptomics data.Brief Bioinform. 2024 Mar 27;25(3):bbae188. doi: 10.1093/bib/bbae188. Brief Bioinform. 2024. PMID: 38678389 Free PMC article.
-
Using transfer learning from prior reference knowledge to improve the clustering of single-cell RNA-Seq data.Sci Rep. 2019 Dec 30;9(1):20353. doi: 10.1038/s41598-019-56911-z. Sci Rep. 2019. PMID: 31889137 Free PMC article.
-
Machine learning for discovering missing or wrong protein function annotations : A comparison using updated benchmark datasets.BMC Bioinformatics. 2019 Sep 23;20(1):485. doi: 10.1186/s12859-019-3060-6. BMC Bioinformatics. 2019. PMID: 31547800 Free PMC article. Review.
-
Revolutionizing Digital Pathology With the Power of Generative Artificial Intelligence and Foundation Models.Lab Invest. 2023 Nov;103(11):100255. doi: 10.1016/j.labinv.2023.100255. Epub 2023 Sep 26. Lab Invest. 2023. PMID: 37757969 Review.
Cited by
-
Vitessce: integrative visualization of multimodal and spatially resolved single-cell data.Nat Methods. 2024 Sep 27. doi: 10.1038/s41592-024-02436-x. Online ahead of print. Nat Methods. 2024. PMID: 39333268
-
DRAVA: Aligning Human Concepts with Machine Learning Latent Dimensions for the Visual Exploration of Small Multiples.Proc SIGCHI Conf Hum Factor Comput Syst. 2023 Apr;2023:833. doi: 10.1145/3544548.3581127. Epub 2023 Apr 19. Proc SIGCHI Conf Hum Factor Comput Syst. 2023. PMID: 38074525 Free PMC article.
-
Omics data integration in computational biology viewed through the prism of machine learning paradigms.Front Bioinform. 2023 Aug 4;3:1191961. doi: 10.3389/fbinf.2023.1191961. eCollection 2023. Front Bioinform. 2023. PMID: 37600970 Free PMC article. Review.
References
-
- Argelaguet R, Cuomo AS, Stegle O, and Marioni JC. Computational principles and challenges in single-cell data integration. Nature Biotechnology, 39(10):1202–1215, 2021. - PubMed
-
- Barkas N, Petukhov V, Kharchenko P, and Biederstedt E. pagoda2: Single cell analysis and differential expression. https://github.com/kharchenkolab/pagoda2, 2021.

