Enhanced Spatial Mapping of Histone Proteoforms in Human Kidney Through MALDI-MSI by High-Field UHMR-Orbitrap Detection
- PMID: 36067026
- PMCID: PMC10064997
- DOI: 10.1021/acs.analchem.2c01034
Enhanced Spatial Mapping of Histone Proteoforms in Human Kidney Through MALDI-MSI by High-Field UHMR-Orbitrap Detection
Abstract
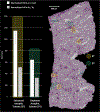
Core histones including H2A, H2B, H3, and H4 are key modulators of cellular repair, transcription, and replication within eukaryotic cells, playing vital roles in the pathogenesis of disease and cellular responses to environmental stimuli. Traditional mass spectrometry (MS)-based bottom-up and top-down proteomics allows for the comprehensive identification of proteins and of post-translational modification (PTM) harboring proteoforms. However, these methodologies have difficulties preserving near-cellular spatial distributions because they typically require laser capture microdissection (LCM) and advanced sample preparation techniques. Herein, we coupled a matrix-assisted laser desorption/ionization (MALDI) source with a Thermo Scientific Q Exactive HF Orbitrap MS upgraded with ultrahigh mass range (UHMR) boards for the first demonstration of complementary high-resolution accurate mass (HR/AM) measurements of proteoforms up to 16.5 kDa directly from tissues using this benchtop mass spectrometer. The platform achieved isotopic resolution throughout the detected mass range, providing confident assignments of proteoforms with low ppm mass error and a considerable increase in duty cycle over other Fourier transform mass analyzers. Proteoform mapping of core histones was demonstrated on sections of human kidney at near-cellular spatial resolution, with several key distributions of histone and other proteoforms noted within both healthy biopsy and a section from a renal cell carcinoma (RCC) containing nephrectomy. The use of MALDI-MS imaging (MSI) for proteoform mapping demonstrates several steps toward high-throughput accurate identification of proteoforms and provides a new tool for mapping biomolecule distributions throughout tissue sections in extended mass ranges.
Conflict of interest statement
The authors declare the following competing financial interest(s): K.L.F, M.R.S., and A.A.M. declare the following competing financial interest(s): these authors are employees of Thermo Fisher Scientific, manufacturer of Orbitrap mass spectrometers.
Figures


Similar articles
-
Spatial top-down proteomics for the functional characterization of human kidney.bioRxiv [Preprint]. 2024 Jul 5:2024.02.13.580062. doi: 10.1101/2024.02.13.580062. bioRxiv. 2024. PMID: 38405958 Free PMC article. Preprint.
-
193 nm Ultraviolet Photodissociation for the Characterization of Singly Charged Proteoforms Generated by MALDI.J Am Soc Mass Spectrom. 2023 Feb 1;34(2):328-332. doi: 10.1021/jasms.2c00302. Epub 2023 Jan 9. J Am Soc Mass Spectrom. 2023. PMID: 36622763 Free PMC article.
-
Top-"Double-Down" Mass Spectrometry of Histone H4 Proteoforms: Tandem Ultraviolet-Photon and Mobility/Mass-Selected Electron Capture Dissociations.Anal Chem. 2022 Nov 8;94(44):15377-15385. doi: 10.1021/acs.analchem.2c03147. Epub 2022 Oct 25. Anal Chem. 2022. PMID: 36282112 Free PMC article.
-
ADVANCES IN HIGH-RESOLUTION MALDI MASS SPECTROMETRY FOR NEUROBIOLOGY.Mass Spectrom Rev. 2022 Mar;41(2):194-214. doi: 10.1002/mas.21661. Epub 2020 Nov 9. Mass Spectrom Rev. 2022. PMID: 33165982 Free PMC article. Review.
-
Mass spectrometric immunoassays for discovery, screening and quantification of clinically relevant proteoforms.Bioanalysis. 2016 Aug;8(15):1623-1633. doi: 10.4155/bio-2016-0060. Epub 2016 Jul 11. Bioanalysis. 2016. PMID: 27396364 Free PMC article. Review.
Cited by
-
Laser capture microdissection and native mass spectrometry for spatially-resolved analysis of intact protein assemblies in tissue.Chem Sci. 2024 Mar 7;15(15):5723-5729. doi: 10.1039/d3sc04933g. eCollection 2024 Apr 17. Chem Sci. 2024. PMID: 38638209 Free PMC article.
-
Imaging Mass Spectrometry of Isotopically Resolved Intact Proteins on a Trapped Ion-Mobility Quadrupole Time-of-Flight Mass Spectrometer.Anal Chem. 2024 Apr 2;96(13):5065-5070. doi: 10.1021/acs.analchem.3c05252. Epub 2024 Mar 22. Anal Chem. 2024. PMID: 38517028 Free PMC article.
-
Spatial top-down proteomics for the functional characterization of human kidney.bioRxiv [Preprint]. 2024 Jul 5:2024.02.13.580062. doi: 10.1101/2024.02.13.580062. bioRxiv. 2024. PMID: 38405958 Free PMC article. Preprint.
-
An Orbitrap/Time-of-Flight Mass Spectrometer for Photofragment Ion Imaging and High-Resolution Mass Analysis of Native Macromolecular Assemblies.J Am Soc Mass Spectrom. 2023 Jul 5;34(7):1359-1371. doi: 10.1021/jasms.3c00053. Epub 2023 Jun 15. J Am Soc Mass Spectrom. 2023. PMID: 37319176 Free PMC article.
-
Integrated data-driven and experimental approaches to accelerate lead optimization targeting SARS-CoV-2 main protease.J Comput Aided Mol Des. 2023 Aug;37(8):339-355. doi: 10.1007/s10822-023-00509-1. Epub 2023 Jun 14. J Comput Aided Mol Des. 2023. PMID: 37314632
References
Publication types
MeSH terms
Substances
Grants and funding
LinkOut - more resources
Full Text Sources
Research Materials
Miscellaneous

