Pharmacological inhibition and reversal of pancreatic acinar ductal metaplasia
- PMID: 36055991
- PMCID: PMC9440259
- DOI: 10.1038/s41420-022-01165-4
Pharmacological inhibition and reversal of pancreatic acinar ductal metaplasia
Abstract
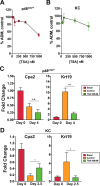
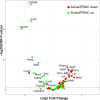
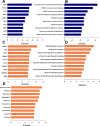
Pancreatic acinar cells display a remarkable degree of plasticity and can dedifferentiate into ductal-like progenitor cells by a process known as acinar ductal metaplasia (ADM). ADM is believed to be one of the earliest precursor lesions toward the development of pancreatic ductal adenocarcinoma and maintaining the pancreatic acinar cell phenotype suppresses tumor formation. The effects of a novel pStat3 inhibitor (LLL12B) and the histone deacetylase (HDAC) inhibitor trichostatin A (TSA) were investigated using 3-D cultures from p48Cre/+ and p48Cre/+LSL-KrasG12D/+ (KC) mice. LLL12B and TSA inhibited ADM in both KC and p48Cre/+ mouse pancreatic organoids. Furthermore, treatment with LLL12B or TSA on dedifferentiated acini from p48Cre/+ and KC mice that had undergone ADM produced morphologic and gene expression changes that suggest a reversal of ADM. Validation experiments using qRT-PCR (p48Cre/+ and KC) and RNA sequencing (KC) of the LLL12B and TSA treated cultures showed that the ADM reversal was more robust for the TSA treatments. Pathway analysis showed that TSA inhibited Spink1 and PI3K/AKT signaling during ADM reversal. The ability of TSA to reverse ADM was also observed in primary human acinar cultures. We report that pStat3 and HDAC inhibition can attenuate ADM in vitro and reverse ADM in the context of wild-type Kras. Our findings suggest that pharmacological inhibition or reversal of pancreatic ADM represents a potential therapeutic strategy for blocking aberrant ductal reprogramming of acinar cells.
© 2022. The Author(s).
Conflict of interest statement
The authors declare no competing interests.
Figures


Similar articles
-
Epigenetic small-molecule screen for inhibition and reversal of acinar ductal metaplasia in mouse pancreatic organoids.Front Pharmacol. 2024 Mar 6;15:1335246. doi: 10.3389/fphar.2024.1335246. eCollection 2024. Front Pharmacol. 2024. PMID: 38510657 Free PMC article.
-
Epigenetic Small-Molecule Screen for Inhibition and Reversal of Acinar Ductal Metaplasia in Mouse Pancreatic Organoids.bioRxiv [Preprint]. 2023 Nov 27:2023.11.27.567685. doi: 10.1101/2023.11.27.567685. bioRxiv. 2023. Update in: Front Pharmacol. 2024 Mar 06;15:1335246. doi: 10.3389/fphar.2024.1335246. PMID: 38077007 Free PMC article. Updated. Preprint.
-
Krüppel-like Factor 5, Increased in Pancreatic Ductal Adenocarcinoma, Promotes Proliferation, Acinar-to-Ductal Metaplasia, Pancreatic Intraepithelial Neoplasia, and Tumor Growth in Mice.Gastroenterology. 2018 Apr;154(5):1494-1508.e13. doi: 10.1053/j.gastro.2017.12.005. Epub 2017 Dec 15. Gastroenterology. 2018. PMID: 29248441 Free PMC article.
-
Therapeutic potential of targeting acinar cell reprogramming in pancreatic cancer.World J Gastroenterol. 2016 Aug 21;22(31):7046-57. doi: 10.3748/wjg.v22.i31.7046. World J Gastroenterol. 2016. PMID: 27610015 Free PMC article. Review.
-
Acinar cell plasticity and development of pancreatic ductal adenocarcinoma.Nat Rev Gastroenterol Hepatol. 2017 May;14(5):296-304. doi: 10.1038/nrgastro.2017.12. Epub 2017 Mar 8. Nat Rev Gastroenterol Hepatol. 2017. PMID: 28270694 Free PMC article. Review.
Cited by
-
Gradient inflammation in the pancreatic stump after pancreaticoduodenectomy: Two case reports and review of literature.World J Clin Cases. 2024 Mar 26;12(9):1649-1659. doi: 10.12998/wjcc.v12.i9.1649. World J Clin Cases. 2024. PMID: 38576729 Free PMC article.
-
Epigenetic small-molecule screen for inhibition and reversal of acinar ductal metaplasia in mouse pancreatic organoids.Front Pharmacol. 2024 Mar 6;15:1335246. doi: 10.3389/fphar.2024.1335246. eCollection 2024. Front Pharmacol. 2024. PMID: 38510657 Free PMC article.
-
Florida-California Cancer Research, Education and Engagement (CaRE2) Health Equity Center: Structure, Innovations, and Initial Outcomes.Cancer Control. 2023 Jan-Dec;30:10732748231197878. doi: 10.1177/10732748231197878. Cancer Control. 2023. PMID: 37703814 Free PMC article. Review.
-
Transcriptional Profile of Human Pancreatic Acinar Ductal Metaplasia.Gastro Hep Adv. 2023;2(4):532-543. doi: 10.1016/j.gastha.2023.02.003. Epub 2023 Feb 8. Gastro Hep Adv. 2023. PMID: 37425649 Free PMC article.
-
Vitamin E in the management of pancreatic cancer: A scoping review.World J Gastrointest Oncol. 2023 Jun 15;15(6):943-958. doi: 10.4251/wjgo.v15.i6.943. World J Gastrointest Oncol. 2023. PMID: 37389119 Free PMC article. Review.
References
-
- He P, Yang JW, Yang VW, Bialkowska AB. Kruppel-like factor 5, increased in pancreatic ductal adenocarcinoma, promotes proliferation, acinar-to-ductal metaplasia, pancreatic intraepithelial neoplasia, and tumor growth in mice. Gastroenterology. 2018;154:1494–1508.e1413. doi: 10.1053/j.gastro.2017.12.005. - DOI - PMC - PubMed
Grants and funding
LinkOut - more resources
Full Text Sources
Research Materials
Miscellaneous

