. 2022 Sep;609(7926):375-383.
doi: 10.1038/s41586-022-05094-1. Epub 2022 Aug 17.

Spatial profiling of chromatin accessibility in mouse and human tissues

Affiliations

Spatial profiling of chromatin accessibility in mouse and human tissues

Yanxiang Deng et al. Nature. 2022 Sep.

Abstract

Cellular function in tissue is dependent on the local environment, requiring new methods for spatial mapping of biomolecules and cells in the tissue context1. The emergence of spatial transcriptomics has enabled genome-scale gene expression mapping2-5, but the ability to capture spatial epigenetic information of tissue at the cellular level and genome scale is lacking. Here we describe a method for spatially resolved chromatin accessibility profiling of tissue sections using next-generation sequencing (spatial-ATAC-seq) by combining in situ Tn5 transposition chemistry6 and microfluidic deterministic barcoding5. Profiling mouse embryos using spatial-ATAC-seq delineated tissue-region-specific epigenetic landscapes and identified gene regulators involved in the development of the central nervous system. Mapping the accessible genome in the mouse and human brain revealed the intricate arealization of brain regions. Applying spatial-ATAC-seq to tonsil tissue resolved the spatially distinct organization of immune cell types and states in lymphoid follicles and extrafollicular zones. This technology progresses spatial biology by enabling spatially resolved chromatin accessibility profiling to improve our understanding of cell identity, cell state and cell fate decision in relation to epigenetic underpinnings in development and disease.


Conflict of interest statement

R.F. and Y.D. are inventors of a patent application related to this work (PCT Patent Application No. PCT/US2021/065669). R.F. is scientific founder and advisor of IsoPlexis, Singleron Biotechnologies and AtlasXomics. The interests of R.F. were reviewed and managed by Yale University Provost’s Office in accordance with the University’s conflict of interest policies. The other authors declare no competing interests.

Figures
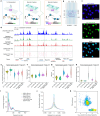
Fig. 1
Fig. 1. Spatial-ATAC-seq design, workflow and data quality.
a, Schematic workflow. Tn5 transposition was performed in tissue sections, followed by in situ ligation of two sets of DNA barcodes (A1–A50, B1–B50). b, Microfluidic crossflow scheme. c, Validation of in situ transposition and ligation using fluorescent DNA probes. Tn5 transposition was performed in 3T3 cells on a glass slide stained with DAPI (blue). Next, FITC-labelled barcode A was ligated to the adapters on the transposase-accessible genomic DNA. Scale bar, 50 µm. d, Aggregate spatial chromatin accessibility profiles recapitulated published profiles of ATAC-seq in the liver of E13 mouse embryos. e, Comparison of the number of unique fragments between spatial-ATAC-seq and 10x scATAC-seq. f, Comparison of the fraction of TSS fragments between spatial-ATAC-seq and 10x scATAC-seq. g, Comparison of the fraction of mitochondrial fragments between spatial-ATAC-seq and 10x scATAC-seq. h, Comparison of the fraction of reads in peaks (FRiP) between spatial-ATAC-seq and 10x scATAC-seq. The number of pixels/cells in E11: 2,162; E13: 2,275; brain: 2,500; tonsil: 2,488; scATAC-seq: 3,789. The box plots show the median (centre line), the first and third quartiles (box limits), and 1.5× the interquartile range (whiskers). i, Comparison of the insert size distribution of ATAC-seq fragments between spatial-ATAC-seq and 10x scATAC-seq. j, Comparison of the enrichment of ATAC-seq reads around TSSs between spatial-ATAC-seq and 10x scATAC-seq. Colouring is consistent with i. k, The TSS enrichment score versus unique nuclear fragments per cell in human tonsils.
Fig. 2
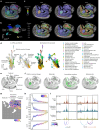
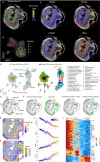
Fig. 2. Spatial chromatin accessibility mapping of E13 mouse embryos.
a, An unbiased clustering analysis was performed on the basis of the chromatin accessibility of all tissue pixels (50 μm pixel size). An overlay of clusters with the tissue image reveals that the spatial chromatin accessibility clusters precisely match the anatomical regions. For better visualization, we scaled the size of the pixels. b, UMAP embedding of the unsupervised clustering analysis for chromatin accessibility. Cluster identities and colouring of clusters are consistent with a. c, The spatial mapping of gene scores for selected marker genes in different clusters and the chromatin accessibility at selected genes are highly tissue specific. d, Integration of scRNA-seq from E13.5 mouse embryos and spatial-ATAC-seq data. Unsupervised clustering of the combined data was coloured by different cell types. MOCA, Mouse Organogenesis Cell Atlas. e, Anatomical annotation of major tissue regions based on the haematoxylin and eosin (H&E)-stained image. f, Spatial mapping of selected cell types identified by label transferring from scRNA-seq to spatial-ATAC-seq data. g, Pseudotemporal reconstruction from the developmental process from radial glia, postmitotic premature neurons, to excitatory neurons plotted in space. h, The dynamics of the gene scores of selected genes along the pseudotime shown in g. i, The dynamics of the chromatin accessibility of individual regulatory elements at Pou3f2 and Nova2 (highlighted in grey boxes). Scale bar, 20 kb.
Fig. 3
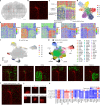
Fig. 3. Spatial chromatin accessibility mapping and integrative analysis of P21 mouse brain with a 20 µm pixel size.
a, Bright-field image of a mouse brain tissue section and the region of interest for mapping (red dashed box). Scale bar, 1 mm. b, Fluorescence image of nuclear staining with 7-AAD in the region of interest for spatial-ATAC-seq mapping. Scale bar, 200 µm. c,d, Unsupervised clustering analysis (c) and the spatial distribution (d) of each cluster in the mouse brain. For better visualization, we scaled the size of the pixels. e, Spatial mapping of gene scores for selected marker genes in different clusters. f,g, Integration of scATAC-seq from mouse brains (f) and spatial-ATAC-seq (g). h, Spatial mapping of selected cell types identified by label transfer from scRNA-seq to spatial-ATAC-seq. i, The spatial location of pixels containing a single nucleus. j, Fluorescence images of selected pixels containing a single nucleus. k, Heat map of the gene scores of selected pixels containing a single nucleus. A list of abbreviation definitions can be found in Supplementary Table 2.
Fig. 4
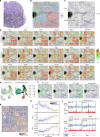
Fig. 4. Spatial chromatin accessibility mapping of a human tonsil with a 20 µm pixel size.
a, H&E image of a human tonsil from an adjacent tissue section and a region of interest for spatial chromatin accessibility mapping. Scale bar, 1 mm. b, Unsupervised clustering analysis and spatial distribution of each cluster. For better visualization, we scaled the size of the pixels. c, Anatomical annotation of major tonsillar regions. d, Spatial mapping of the gene scores for selected genes. e, Integration of scRNA-seq data and spatial-ATAC-seq data. Unsupervised clustering of the combined data was coloured by different cell types. f, Spatial mapping of selected cell types identified by label transferring from scRNA-seq to spatial-ATAC-seq data. Scale bar, 500 µm. g, Pseudotemporal reconstruction from the developmental process from naive B cells to GC B cells plotted in space. h, Dynamics of the gene scores of selected genes along the pseudotime shown in g. i, Dynamics of the chromatin accessibility of individual regulatory elements along pseudotime (highlighted in grey boxes). Fine-mapped autoimmune-associated GWAS variants and high-resolution individual single-nucleotide polymorphism loci localizing to accessible chromatin are shown. Scale bar, 25 kb.
Extended Data Fig. 1
Extended Data Fig. 1. Chemistry workflow of spatial-ATAC-seq.
A tissue section on a standard aminated glass slide was lightly fixed with formaldehyde. Then, Tn5 transposition was performed at 37 °C, and the adapters containing ligation linker 1 were inserted to the cleaved genomic DNA at transposase accessible sites. Afterwards, a set of DNA barcode A solutions were introduced by microchannel-guided flow delivery to perform in situ ligation reaction for appending a distinct spatial barcode Ai (i = 1–50) and ligation linker 2. Then, a second set of barcodes Bj (j = 1-50) were introduced using another set of microfluidic channels perpendicularly to those in the first flow barcoding step, which were subsequently ligated at the intersections, resulting in a mosaic of tissue pixels, each containing a distinct combination of barcodes Ai and Bj (i = 1–50, j = 1–50). After DNA fragments were collected by reversing cross-linking, the library construction was completed during PCR amplification.
Extended Data Fig. 2
Extended Data Fig. 2. Further analysis of spatial chromatin accessibility mapping of E13 mouse embryo and validation with ENCODE reference data.
a, H&E image from an adjacent tissue section and a region of interest for spatial chromatin accessibility mapping (50 µm pixel size). b, Unsupervised clustering analysis and spatial distribution of each cluster. For better visualization, we scaled the size of the pixels. c, Genome browser tracks of selected marker genes in different clusters. d, UMAP embedding of unsupervised clustering analysis for spatial-ATAC-seq. Cluster identities and colouring of clusters are consistent with (b). e, LSI projection of ENCODE bulk ATAC-seq data from diverse cell types of the E13.5 mouse embryo dataset onto the spatial ATAC-seq embedding. f, UMAP embedding of unsupervised clustering analysis for ENCODE bulk ATAC-seq data from diverse cell types of the E13.5 mouse embryo dataset. g, LSI projection of spatial-ATAC-seq data onto ENCODE bulk ATAC-seq embedding. h, Spatial mapping of gene scores for selected marker genes in different clusters.
Extended Data Fig. 3
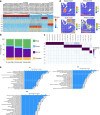
Extended Data Fig. 3. Motif enrichment analysis of the E13 mouse embryo data.
a, Heatmap of spatial-ATAC-seq marker peaks across all clusters identified with bias-matched differential testing. b, Annotation of marker peaks across clusters. c, Heatmap of motif hypergeometric enrichment-adjusted P values within the marker peaks of each cluster. d, Spatial mapping of selected TF motif deviation scores. e, GREAT enrichment analysis of marker peaks across clusters.
Extended Data Fig. 4
Extended Data Fig. 4. Spatial chromatin accessibility mapping of E11 mouse embryo and spatiotemporal analysis (50 µm pixel size).
a, Unsupervised clustering analysis and spatial distribution of each cluster. Overlay with the tissue image reveals that the spatial chromatin accessibility clusters precisely match the anatomic regions. For better visualization, we scaled the size of the pixels. b, UMAP embedding of unsupervised clustering analysis for chromatin accessibility. Cluster identities and colouring of clusters are consistent with (a). c, Spatial mapping of gene scores for selected marker genes in different clusters and the chromatin accessibility at select genes are highly tissue specific. d, Integration of scRNA-seq from E11.5 mouse embryos and spatial ATAC-seq data. Unsupervised clustering of the combined data was coloured by different cell types. e, Anatomic annotation of major tissue regions based on the H&E image. f, Spatial mapping of selected cell types identified by label transferring from scRNA-seq to spatial ATAC-seq data. g, Pseudotemporal reconstruction from the developmental process from radial glia to excitatory neurons plotted in space. h, Spatial mapping of gene scores for Notch1. i, dynamics for selected gene score along the pseudo-time shown in (g). j, Pseudo-time heatmap of TF motifs changes from radial glia to excitatory neurons.
Extended Data Fig. 5
Extended Data Fig. 5. Further analysis of spatial chromatin accessibility mapping of E11 mouse embryo (50 µm pixel size) and validation with the ENCODE reference data.
a, H&E image from an adjacent tissue section and a region of interest for spatial chromatin accessibility mapping. b, Unsupervised clustering analysis and spatial distribution of each cluster. For better visualization, we scaled the size of the pixels. c, Genome browser tracks of selected marker genes in different clusters. d, UMAP embedding of unsupervised clustering analysis for spatial ATAC-seq. Cluster identities and colouring of clusters are consistent with (b). e, LSI projection of ENCODE bulk ATAC-seq data from diverse cell types of the E11.5 mouse embryo dataset onto the spatial-ATAC-seq embedding. f, UMAP embedding of unsupervised clustering analysis for ENCODE bulk ATAC-seq data from diverse cell types of the E11.5 mouse embryo dataset. g, LSI projection of spatial ATAC-seq data onto ENCODE bulk ATAC-seq embedding. h, Spatial mapping of gene scores for selected marker genes in different clusters.
Extended Data Fig. 6
Extended Data Fig. 6. Motif enrichment analysis in E11 mouse embryo.
a, Heatmap of spatial ATAC-seq marker peaks across all clusters identified with bias-matched differential testing. b, Annotation of marker peaks across clusters. c, d, Spatial mapping of selected TF motif deviation scores. e, GREAT enrichment analysis of marker peaks across clusters.
Extended Data Fig. 7
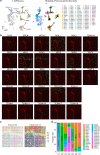
Extended Data Fig. 7. Spatial chromatin accessibility mapping of E11 mouse embryo and spatiotemporal analysis (20 µm pixel size).
a, Unsupervised clustering analysis and spatial distribution of each cluster. Overlay with the tissue image reveals that the spatial chromatin accessibility clusters precisely match the anatomic regions. For better visualization, we scaled the size of the pixels. b, UMAP embedding of unsupervised clustering analysis for chromatin accessibility. Cluster identities and colouring of clusters are consistent with (a). c, Spatial mapping of notochord cells identified by label transferring from scRNA-seq (E11.5 mouse embryos) to spatial ATAC-seq data. d, Spatial mapping of gene scores for selected marker genes in different clusters and the chromatin accessibility at select genes are highly tissue specific.
Extended Data Fig. 8
Extended Data Fig. 8. Integrative analysis of spatial-ATAC-seq and scRNA-seq for P21 mouse brain.
a, Integration of scRNA-seq from mouse brains and spatial-ATAC-seq data. b, Spatial mapping of cell types identified by label transfer from scRNA-seq to spatial-ATAC-seq. c, Spatial distribution of each cluster in the mouse brain with real (left) and enlarged (right) pixel size. d, Fraction of cell types in each spatial-ATAC-seq cluster. A list of abbreviation definitions can be found in Supplementary Table 2.
Extended Data Fig. 9
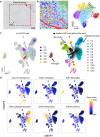
Extended Data Fig. 9. Spatial chromatin accessibility mapping of human hippocampus.
a, Nissl-stained tissue section adjacent to the one used for spatial chromatin accessibility mapping and region of interest for spatial-ATAC-seq (50 µm pixel size). b, Unsupervised clustering analysis and spatial distribution of each cluster. For better visualization, we scaled the size of the pixels. c, Integration of scATAC-seq from human hippocampus and spatial-ATAC-seq. Colouring of spatial-ATAC-seq is consistent with (b). d, Co-embedding spatial-ATAC-seq and scATAC-seq datasets, coloured by gene score for the annotated lineage-defining gene.
Extended Data Fig. 10
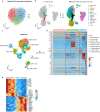
Extended Data Fig. 10. Further analysis of spatial chromatin accessibility mapping of human tonsil.
a, UMAP of tonsillar spatial-ATAC-seq data. b, Integration of scATAC-seq from human tonsils and spatial-ATAC-seq. c, UMAP of tonsillar immune scRNA-seq reference data. d, Heatmap comparing key marker gene expression across selected immune cell types. e, Pseudo-time heatmap of TF motifs changes from Naïve B cells to GC B cells.

Similar articles

Cited by

References

    1. Perkel JM. Starfish enterprise: finding RNA patterns in single cells. Nature. 2019;572:549–551. doi: 10.1038/d41586-019-02477-9. - DOI - PubMed
    1. Chen, K. H., Boettiger, A. N., Moffitt, J. R., Wang, S. Y. & Zhuang, X. W. Spatially resolved, highly multiplexed RNA profiling in single cells. Science348, aaa6090 (2015). - PMC - PubMed
    1. Eng CL, et al. Transcriptome-scale super-resolved imaging in tissues by RNA seqFISH+ Nature. 2019;568:235–239. doi: 10.1038/s41586-019-1049-y. - DOI - PMC - PubMed
    1. Rodriques SG, et al. Slide-seq: a scalable technology for measuring genome-wide expression at high spatial resolution. Science. 2019;363:1463–1467. doi: 10.1126/science.aaw1219. - DOI - PMC - PubMed
    1. Liu Y, et al. High-spatial-resolution multi-omics sequencing via deterministic barcoding in tissue. Cell. 2020;183:1665–1681. doi: 10.1016/j.cell.2020.10.026. - DOI - PMC - PubMed