Rapid Multivariate Analysis Approach to Explore Differential Spatial Protein Profiles in Tissue
- PMID: 35849531
- PMCID: PMC9845430
- DOI: 10.1021/acs.jproteome.2c00206
Rapid Multivariate Analysis Approach to Explore Differential Spatial Protein Profiles in Tissue
Abstract
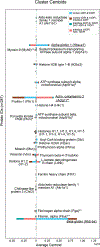
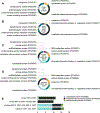
Spatially targeted proteomics analyzes the proteome of specific cell types and functional regions within tissue. While spatial context is often essential to understanding biological processes, interpreting sub-region-specific protein profiles can pose a challenge due to the high-dimensional nature of the data. Here, we develop a multivariate approach for rapid exploration of differential protein profiles acquired from distinct tissue regions and apply it to analyze a published spatially targeted proteomics data set collected from Staphylococcus aureus-infected murine kidney, 4 and 10 days postinfection. The data analysis process rapidly filters high-dimensional proteomic data to reveal relevant differentiating species among hundreds to thousands of measured molecules. We employ principal component analysis (PCA) for dimensionality reduction of protein profiles measured by microliquid extraction surface analysis mass spectrometry. Subsequently, k-means clustering of the PCA-processed data groups samples by chemical similarity. Cluster center interpretation revealed a subset of proteins that differentiate between spatial regions of infection over two time points. These proteins appear involved in tricarboxylic acid metabolomic pathways, calcium-dependent processes, and cytoskeletal organization. Gene ontology analysis further uncovered relationships to tissue damage/repair and calcium-related defense mechanisms. Applying our analysis in infectious disease highlighted differential proteomic changes across abscess regions over time, reflecting the dynamic nature of host-pathogen interactions.
Keywords: Staphylococcus aureus; abscess formation; bioinformatics; computational proteomics; host−pathogen interface; machine learning; mass spectrometry; microLESA; proteomics; spatially targeted proteomics.
Conflict of interest statement
The authors declare no competing financial interest.
Figures


Similar articles
-
Spatially Targeted Proteomics of the Host-Pathogen Interface during Staphylococcal Abscess Formation.ACS Infect Dis. 2021 Jan 8;7(1):101-113. doi: 10.1021/acsinfecdis.0c00647. Epub 2020 Dec 3. ACS Infect Dis. 2021. PMID: 33270421 Free PMC article.
-
MicroLESA: Integrating Autofluorescence Microscopy, In Situ Micro-Digestions, and Liquid Extraction Surface Analysis for High Spatial Resolution Targeted Proteomic Studies.Anal Chem. 2019 Jun 18;91(12):7578-7585. doi: 10.1021/acs.analchem.8b05889. Epub 2019 May 31. Anal Chem. 2019. PMID: 31149808 Free PMC article.
-
Systems integration of biodefense omics data for analysis of pathogen-host interactions and identification of potential targets.PLoS One. 2009 Sep 25;4(9):e7162. doi: 10.1371/journal.pone.0007162. PLoS One. 2009. PMID: 19779614 Free PMC article.
-
Translational Metabolomics of Head Injury: Exploring Dysfunctional Cerebral Metabolism with Ex Vivo NMR Spectroscopy-Based Metabolite Quantification.In: Kobeissy FH, editor. Brain Neurotrauma: Molecular, Neuropsychological, and Rehabilitation Aspects. Boca Raton (FL): CRC Press/Taylor & Francis; 2015. Chapter 25. In: Kobeissy FH, editor. Brain Neurotrauma: Molecular, Neuropsychological, and Rehabilitation Aspects. Boca Raton (FL): CRC Press/Taylor & Francis; 2015. Chapter 25. PMID: 26269925 Free Books & Documents. Review.
-
Functional genomics and proteomics in the clinical neurosciences: data mining and bioinformatics.Prog Brain Res. 2006;158:83-108. doi: 10.1016/S0079-6123(06)58004-5. Prog Brain Res. 2006. PMID: 17027692 Review.
Cited by
-
Spatial proteomics: unveiling the multidimensional landscape of protein localization in human diseases.Proteome Sci. 2024 Sep 20;22(1):7. doi: 10.1186/s12953-024-00231-2. Proteome Sci. 2024. PMID: 39304896 Free PMC article. Review.
-
Special Issue with Research Topics on "Recent Analysis and Applications of Mass Spectra on Biochemistry".Int J Mol Sci. 2024 Feb 7;25(4):1995. doi: 10.3390/ijms25041995. Int J Mol Sci. 2024. PMID: 38396673 Free PMC article.
-
MALDI IMS-Derived Molecular Contour Maps: Augmenting Histology Whole-Slide Images.J Am Soc Mass Spectrom. 2023 May 3;34(5):905-912. doi: 10.1021/jasms.2c00370. Epub 2023 Apr 16. J Am Soc Mass Spectrom. 2023. PMID: 37061946 Free PMC article.
-
Mass Spectrometry-Based Glycoproteomic Workflows for Cancer Biomarker Discovery.Technol Cancer Res Treat. 2023 Jan-Dec;22:15330338221148811. doi: 10.1177/15330338221148811. Technol Cancer Res Treat. 2023. PMID: 36740994 Free PMC article. Review.
References
-
- Aebersold R; Mann M Mass spectrometry-based proteomics. Nature 2003, 422, 198–207. - PubMed
-
- Bantscheff M; Schirle M; Sweetman G; Rick J; Kuster B Quantitative mass spectrometry in proteomics: a critical review. Anal. Bioanal. Chem. 2007, 389, 1017–1031. - PubMed
-
- Yates JR; Ruse CI; Nakorchevsky A Proteomics by Mass Spectrometry: Approaches, Advances, and Applications. Annu. Rev. Biomed. Eng. 2009, 11, 49–79. - PubMed
Publication types
MeSH terms
Substances
Grants and funding
LinkOut - more resources
Full Text Sources

