. 2022 Jul 7;23(1):150.
doi: 10.1186/s13059-022-02716-9.

scSTEM: clustering pseudotime ordered single-cell data

Affiliations

scSTEM: clustering pseudotime ordered single-cell data

Qi Song et al. Genome Biol. .

Abstract

We develop scSTEM, single-cell STEM, a method for clustering dynamic profiles of genes in trajectories inferred from pseudotime ordering of single-cell RNA-seq (scRNA-seq) data. scSTEM uses one of several metrics to summarize the expression of genes and assigns a p-value to clusters enabling the identification of significant profiles and comparison of profiles across different paths. Application of scSTEM to several scRNA-seq datasets demonstrates its usefulness and ability to improve downstream analysis of biological processes. scSTEM is available at https://github.com/alexQiSong/scSTEM .

Keywords: Gene clustering; Genomics; Single cell; Visualization.


Conflict of interest statement

The authors declare that they have no competing interests.

Figures
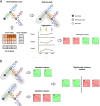
Fig. 1
Fig. 1
Flowchart of scSTEM pipeline. A The flowchart of scSTEM gene clustering. Colored solid circles represent cells mapped to different key segments of a trajectory tree. Aggregation of expressions are performed for each key segment. The resulted matrix (rows as genes and column as key segments) will be used as input for STEM to perform gene clustering. B Comparison function enables comparison of clustering results from different trajectory paths. This will identify clusters having similar genes but showing different/similar temporal expression patterns
Fig. 2
Fig. 2
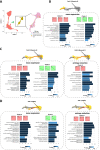
scSTEM results for human fetal immune cells. A UMAP visualization of human fetal immune data set. B scSTEM results for path 1 (NK cell-related path), with top 10 enriched GO terms (ranked by enrichment fold). C Comparison of scSTEM results between using Monocle3 and using Slingshot as trajectory inference method. The top 10 enriched GO terms have shown T cell-related activities. D scSTEM results and enriched GO terms for path 5, a T cell-related path. The top 10 enriched GO terms have shown T cell-related activities. Black curves indicate the trajectory tree, and the highlighted red curves are edges along one selected path. Yellow cells are cells mapped to the selected path and grey cells are other remaining cells
Fig. 3
Fig. 3
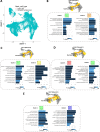
scSTEM results for mouse embryonic blood cells and comparison for different trajectory inference methods and different gene summarization methods. A UMAP visualization of mouse embryonic blood cell data set. B scSTEM results for path 1, with top 10 enriched GO term (ranked by enrichment fold). C scSTEM results and the top 10 enriched GO terms for different trajectory inference methods and different gene summarization methods. Black curves indicate the trajectory tree, and the highlighted red curves are edges along one selected path. Yellow cells are cells mapped to the selected path and grey cells are other remaining cells
Fig. 4
Fig. 4
scSTEM results for mouse embryonic neural crest cells. A UMAP visualization of mouse embryonic neural crest cell data set. B–D scSTEM results and the top 10 enriched GO terms (ranked by enrichment fold) for clusters in different trajectory paths. Black curves indicate the trajectory tree, and the highlighted red curves are edges along one selected path. Yellow cells are cells mapped to the selected path and grey cells are other remaining cells
Fig. 5
Fig. 5
Comparison of functional gene clusters in human fetal immune cell data set. A The Comparison for clustering results between NK cell path and T cell paths. Each row on the left side represents one scSTEM cluster from path 2 (NK cell path), which significantly overlapped with each cluster shown on the right side (clusters from T cell path). Highlighted clusters are the ones significantly enriched for NK cell markers in each path. Black curves indicate the trajectory tree, and the highlighted red curves are edges along one selected path. Yellow cells are cells mapped to the selected path and grey cells are other remaining cells. B Differentiation of T cells and NK cells. C The top 10 enriched GO terms for path 2 (NK cell path, ranked by enrichment fold), cluster 0 (highlighted in A)

Similar articles

Cited by

  • Single-cell genomics and regulatory networks for 388 human brains.
    Emani PS, Liu JJ, Clarke D, Jensen M, Warrell J, Gupta C, Meng R, Lee CY, Xu S, Dursun C, Lou S, Chen Y, Chu Z, Galeev T, Hwang A, Li Y, Ni P, Zhou X; PsychENCODE Consortium‡; Bakken TE, Bendl J, Bicks L, Chatterjee T, Cheng L, Cheng Y, Dai Y, Duan Z, Flaherty M, Fullard JF, Gancz M, Garrido-Martín D, Gaynor-Gillett S, Grundman J, Hawken N, Henry E, Hoffman GE, Huang A, Jiang Y, Jin T, Jorstad NL, Kawaguchi R, Khullar S, Liu J, Liu J, Liu S, Ma S, Margolis M, Mazariegos S, Moore J, Moran JR, Nguyen E, Phalke N, Pjanic M, Pratt H, Quintero D, Rajagopalan AS, Riesenmy TR, Shedd N, Shi M, Spector M, Terwilliger R, Travaglini KJ, Wamsley B, Wang G, Xia Y, Xiao S, Yang AC, Zheng S, Gandal MJ, Lee D, Lein ES, Roussos P, Sestan N, Weng Z, White KP, Won H, Girgenti MJ, Zhang J, Wang D, Geschwind D, Gerstein M; PsychENCODE Consortium. Emani PS, et al. Science. 2024 May 24;384(6698):eadi5199. doi: 10.1126/science.adi5199. Epub 2024 May 24. Science. 2024. PMID: 38781369 Free PMC article.
  • Single-cell genomics and regulatory networks for 388 human brains.
    Emani PS, Liu JJ, Clarke D, Jensen M, Warrell J, Gupta C, Meng R, Lee CY, Xu S, Dursun C, Lou S, Chen Y, Chu Z, Galeev T, Hwang A, Li Y, Ni P, Zhou X; PsychENCODE Consortium; Bakken TE, Bendl J, Bicks L, Chatterjee T, Cheng L, Cheng Y, Dai Y, Duan Z, Flaherty M, Fullard JF, Gancz M, Garrido-Martín D, Gaynor-Gillett S, Grundman J, Hawken N, Henry E, Hoffman GE, Huang A, Jiang Y, Jin T, Jorstad NL, Kawaguchi R, Khullar S, Liu J, Liu J, Liu S, Ma S, Margolis M, Mazariegos S, Moore J, Moran JR, Nguyen E, Phalke N, Pjanic M, Pratt H, Quintero D, Rajagopalan AS, Riesenmy TR, Shedd N, Shi M, Spector M, Terwilliger R, Travaglini KJ, Wamsley B, Wang G, Xia Y, Xiao S, Yang AC, Zheng S, Gandal MJ, Lee D, Lein ES, Roussos P, Sestan N, Weng Z, White KP, Won H, Girgenti MJ, Zhang J, Wang D, Geschwind D, Gerstein M. Emani PS, et al. bioRxiv [Preprint]. 2024 Mar 30:2024.03.18.585576. doi: 10.1101/2024.03.18.585576. bioRxiv. 2024. Update in: Science. 2024 May 24;384(6698):eadi5199. doi: 10.1126/science.adi5199. PMID: 38562822 Free PMC article. Updated. Preprint.
  • Spatial mapping of cellular senescence: emerging challenges and opportunities.
    Gurkar AU, Gerencser AA, Mora AL, Nelson AC, Zhang AR, Lagnado AB, Enninful A, Benz C, Furman D, Beaulieu D, Jurk D, Thompson EL, Wu F, Rodriguez F, Barthel G, Chen H, Phatnani H, Heckenbach I, Chuang JH, Horrell J, Petrescu J, Alder JK, Lee JH, Niedernhofer LJ, Kumar M, Königshoff M, Bueno M, Sokka M, Scheibye-Knudsen M, Neretti N, Eickelberg O, Adams PD, Hu Q, Zhu Q, Porritt RA, Dong R, Peters S, Victorelli S, Pengo T, Khaliullin T, Suryadevara V, Fu X, Bar-Joseph Z, Ji Z, Passos JF. Gurkar AU, et al. Nat Aging. 2023 Jul;3(7):776-790. doi: 10.1038/s43587-023-00446-6. Epub 2023 Jul 3. Nat Aging. 2023. PMID: 37400722 Free PMC article. Review.
  • CellTracer: a comprehensive database to dissect the causative multilevel interplay contributing to cell development trajectories.
    Guo Q, Wang P, Liu Q, Hao Y, Gao Y, Qi Y, Xu R, Chen H, Xin M, Wu X, Sun R, Zhi H, Zhang Y, Ning S, Li X. Guo Q, et al. Nucleic Acids Res. 2023 Jan 6;51(D1):D861-D869. doi: 10.1093/nar/gkac892. Nucleic Acids Res. 2023. PMID: 36243976 Free PMC article.

References

    1. Kiselev VY, Andrews TS, Hemberg M. Challenges in unsupervised clustering of single-cell RNA-seq data. Nat Rev Genet. 2019;20:273–282. doi: 10.1038/s41576-018-0088-9. - DOI - PubMed
    1. Saelens W, Cannoodt R, Todorov H, Saeys Y. A comparison of single-cell trajectory inference methods. Nat Biotechnol. 2019;37:547–554. doi: 10.1038/s41587-019-0071-9. - DOI - PubMed
    1. Song Q, Su J, Miller LD, Zhang W. scLM: Automatic detection of consensus gene clusters across multiple single-cell datasets. Genomics Proteomics Bioinformatics. 2020;19(2):330–341. doi: 10.1016/j.gpb.2020.09.002. - DOI - PMC - PubMed
    1. Strauss ME, Kirk PDW, Reid JE, Wernisch L. GPseudoClust: Deconvolution of shared pseudo-profiles at single-cell resolution. Bioinformatics. 2020;36(5):1484–1491. - PMC - PubMed
    1. Van den Berge K, Roux de Bézieux H, Street K, Saelens W, Cannoodt R, Saeys Y, et al. Trajectory-based differential expression analysis for single-cell sequencing data. Nat Commun. 2020;11:1201. - PMC - PubMed

Publication types

LinkOut - more resources