. 2022 May 13;13(1):2666.
doi: 10.1038/s41467-022-30309-4.

Nuclear oligo hashing improves differential analysis of single-cell RNA-seq

Affiliations

Nuclear oligo hashing improves differential analysis of single-cell RNA-seq

Hyeon-Jin Kim et al. Nat Commun. .

Abstract

Single-cell RNA sequencing (scRNA-seq) offers a high-resolution molecular view into complex tissues, but suffers from high levels of technical noise which frustrates efforts to compare the gene expression programs of different cell types. "Spike-in" RNA standards help control for technical variation in scRNA-seq, but using them with recently developed, ultra-scalable scRNA-seq methods based on combinatorial indexing is not feasible. Here, we describe a simple and cost-effective method for normalizing transcript counts and subtracting technical variability that improves differential expression analysis in scRNA-seq. The method affixes a ladder of synthetic single-stranded DNA oligos to each cell that appears in its RNA-seq library. With improved normalization we explore chemical perturbations with broad or highly specific effects on gene regulation, including RNA pol II elongation, histone deacetylation, and activation of the glucocorticoid receptor. Our methods reveal that inhibiting histone deacetylation prevents cells from executing their canonical program of changes following glucocorticoid stimulation.


Conflict of interest statement

C.T. is a SAB member, consultant, and/or co-founder of Algen Biotechnologies, Altius Therapeutics, and Scale Biosciences. One or more embodiments of one or more patents and patent applications filed by the University of Washington may encompass methods, reagents, and the data disclosed in this manuscript. Some work in this study is related to technology described in patent applications. All other authors declare no competing interests.

Figures

Fig. 1
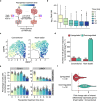
Fig. 1. A set of hash oligos can be captured within nuclei and serve as external standards in sci-RNA-seq experiments.
a An experimental overview of the hash ladder method. Nuclei are isolated from cells, fixed with a ladder of hash oligos, then processed with sci-RNA-seq. b Boxplot of hash oligo UMI counts per cell, each hash oligo spiked in at different abundance (n = 1884 cells). c Scatter plot of expected and observed hash ladder UMI counts, demonstrating a cell with low (left) and high (right) hash capture efficiency. d Boxplot of total RNA count of cells grouped according to the intercept and slope of their hash ladder calibration line (n = 1884 cells). e Distribution of cell-specific size factors computed using the conventional and hash ladder methods. f Scatter plot of normalized average expression and coefficient of variation (CV) of expressed genes in HEK293T. g Comparison of CV values computed with the conventional and hash ladder-based normalization methods. The centerline of the boxplots in b and d indicates the median, the box displays the first and third quartile, and the whiskers show the 1.5 interquartile range (IQR). Outliers are displayed as points.
Fig. 2
Fig. 2. Hash ladder expands our ability to detect global reduction in transcript levels caused by flavopiridol.
a Overview of the experiment. HEK293T cells were treated with flavopiridol for different periods of time and labeled with a ladder of hash oligos and additional hash oligo for multiplexing prior to sci-RNA-seq preparation. b Boxplot showing total RNA UMI counts for cells treated with flavopiridol at different time points (n = 1370 cells). c UMAP projections of flavopiridol treated HEK293T cells colored by treatment time and normalized by conventional (left) and hash ladder (right) size factors. d Barplot showing number of differentially expressed genes in response to flavopiridol using the conventional and hash ladder normalization approaches. e Conventional and hash ladder normalized expression levels of CD151 and LAMC1 at different flavopiridol treatment times. Bars represent the percentage of cells with normalized expression value greater than 1, and the error bars show the 95% confidence interval obtained using a bootstrap method (n = 100 bootstrap samples). f Violin plot showing the ratio of effect size estimates of common differentially expressed genes computed with hash ladder vs. conventional normalization. The centerline of the boxplots in b and f indicates the median, the box displays the first and third quartile, and the whiskers show the 1.5 IQR. Outlier values are displayed as points.
Fig. 3
Fig. 3. Histone deacetylase (HDAC) inhibitor time course trajectory pinpoints onset of acetate starvation.
a UMAP projections of HDAC inhibitor (abexinostat and pracinostat) treated A549 cells (n = 1548 cells over two replicates) colored by treatment time and normalized by conventional (left) and hash ladder (right) size factors. The HDAC inhibitor trajectories are overlaid onto the UMAP projections. b Scatterplot showing total RNA UMIs as a function of pseudotime position obtained from the conventional (left) and hash ladder (right) size factor normalized data. c Hierarchical clustering of 446 of 1485 highly differentially expressed genes along the HDAC inhibitor pseudotime trajectory (likelihood ratio test, FDR < 1 × 10−10 and number of expressed cells > 100). Rows represent row centered and z-scaled dynamics of gene expression. d Histogram of pseudotime points at which the centered, z-scaled expression value is equal to zero for upregulated genes involved in cellular metabolism (n = 188 genes). e Pseudotime distribution of HDAC inhibitor treated cells at each treatment time point. The red dotted line represents the median pseudotime of distributions from Fig. 3c. f Hash ladder normalized expression of genes involved in cellular metabolism and cell cycle across pseudotime, marked by onset of acetate starvation (dotted red line).
Fig. 4
Fig. 4. HDAC inhibition prevents mounting of dexamethasone (DEX) response.
a Overview of the experiment. A549 cells were treated with HDAC inhibitors for different periods of time and dose prior to two hour DEX treatment. These cells were subjected to sci-Plex with the addition of the hash ladder. b UMAP projections of vehicle- and DEX- treated A549 cells (n = 3710 cells over two replicates) in the absence and presence of HDAC inhibitors using the hash ladder normalized expression values. c Percentage of DEX response genes that do not respond to DEX treatment with prior HDAC inhibitor treatment. d Scatter plot comparing log2 fold changes of DEX responsive genes (DEX/vehicle) without and with preceding HDAC inhibitor treatment. Colors respond to the duration of HDAC inhibitor treatment. e Venn diagram of genes that do not respond to DEX at different HDAC inhibitor treatment times. f Hash ladder normalized expression of DEX genes that do not respond in cells that received 4 h (top) and 24 h preceding HDAC inhibitor treatment (bottom).

Similar articles

References

    1. Cao J, et al. Comprehensive single-cell transcriptional profiling of a multicellular organism. Science. 2017;357:661–667. doi: 10.1126/science.aam8940. - DOI - PMC - PubMed
    1. Cao J, et al. The single-cell transcriptional landscape of mammalian organogenesis. Nature. 2019;566:496–502. doi: 10.1038/s41586-019-0969-x. - DOI - PMC - PubMed
    1. van den Brink SC, et al. Single-cell and spatial transcriptomics reveal somitogenesis in gastruloids. Nature. 2020;582:405–409. doi: 10.1038/s41586-020-2024-3. - DOI - PubMed
    1. Saunders, L. M. et al. Thyroid hormone regulates distinct paths to maturation in pigment cell lineages. Elife8, e45181 (2019). - PMC - PubMed
    1. Packer JS, et al. A lineage-resolved molecular atlas of C. elegans embryogenesis at single-cell resolution. Science. 2019;365:eaax1971. doi: 10.1126/science.aax1971. - DOI - PMC - PubMed

Publication types