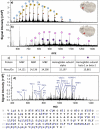
Proteoform-Selective Imaging of Tissues Using Mass Spectrometry
- PMID: 35446460
- PMCID: PMC9276647
- DOI: 10.1002/anie.202200721
Proteoform-Selective Imaging of Tissues Using Mass Spectrometry
Abstract
Unraveling the complexity of biological systems relies on the development of new approaches for spatially resolved proteoform-specific analysis of the proteome. Herein, we employ nanospray desorption electrospray ionization mass spectrometry imaging (nano-DESI MSI) for the proteoform-selective imaging of biological tissues. Nano-DESI generates multiply charged protein ions, which is advantageous for their structural characterization using tandem mass spectrometry (MS/MS) directly on the tissue. Proof-of-concept experiments demonstrate that nano-DESI MSI combined with on-tissue top-down proteomics is ideally suited for the proteoform-selective imaging of tissue sections. Using rat brain tissue as a model system, we provide the first evidence of differential proteoform expression in different regions of the brain.
Keywords: Mass Spectrometry Imaging; On-Tissue Top-down Proteomics; Post-Translational Modifications; Proteoforms.
© 2022 The Authors. Angewandte Chemie International Edition published by Wiley-VCH GmbH.
Conflict of interest statement
The authors declare no conflict of interest.
Figures


Similar articles
-
Nano-DESI Mass Spectrometry Imaging of Proteoforms in Biological Tissues with High Spatial Resolution.Anal Chem. 2023 Mar 28;95(12):5214-5222. doi: 10.1021/acs.analchem.2c04795. Epub 2023 Mar 14. Anal Chem. 2023. PMID: 36917636 Free PMC article.
-
Large-Scale Qualitative and Quantitative Top-Down Proteomics Using Capillary Zone Electrophoresis-Electrospray Ionization-Tandem Mass Spectrometry with Nanograms of Proteome Samples.J Am Soc Mass Spectrom. 2019 Aug;30(8):1435-1445. doi: 10.1007/s13361-019-02167-w. Epub 2019 Apr 9. J Am Soc Mass Spectrom. 2019. PMID: 30972727 Free PMC article.
-
Lipid Coverage in Nanospray Desorption Electrospray Ionization Mass Spectrometry Imaging of Mouse Lung Tissues.Anal Chem. 2019 Sep 17;91(18):11629-11635. doi: 10.1021/acs.analchem.9b02045. Epub 2019 Aug 27. Anal Chem. 2019. PMID: 31412198 Free PMC article.
-
Top-Down Proteomics and the Challenges of True Proteoform Characterization.J Proteome Res. 2023 Dec 1;22(12):3663-3675. doi: 10.1021/acs.jproteome.3c00416. Epub 2023 Nov 8. J Proteome Res. 2023. PMID: 37937372 Free PMC article. Review.
-
Fourier-transform ion cyclotron resonance mass spectrometry for characterizing proteoforms.Mass Spectrom Rev. 2022 Mar;41(2):158-177. doi: 10.1002/mas.21653. Epub 2020 Sep 7. Mass Spectrom Rev. 2022. PMID: 32894796 Free PMC article. Review.
Cited by
-
Next Generation of Mass Spectrometry Imaging: from Micrometer to Subcellular Resolution.Chem Biomed Imaging. 2023 Jul 24;1(8):670-682. doi: 10.1021/cbmi.3c00061. eCollection 2023 Nov 27. Chem Biomed Imaging. 2023. PMID: 39474305 Free PMC article. Review.
-
Nanospray Desorption Electrospray Ionization Mass Spectrometry Imaging (nano-DESI MSI): A Tutorial Review.ACS Meas Sci Au. 2024 Aug 21;4(5):475-487. doi: 10.1021/acsmeasuresciau.4c00028. eCollection 2024 Oct 16. ACS Meas Sci Au. 2024. PMID: 39430971 Free PMC article. Review.
-
Mass spectrometry imaging for spatially resolved multi-omics molecular mapping.Npj Imaging. 2024;2(1):20. doi: 10.1038/s44303-024-00025-3. Epub 2024 Jul 17. Npj Imaging. 2024. PMID: 39036554 Free PMC article. Review.
-
Hardware and software solutions for implementing nanospray desorption electrospray ionization (nano-DESI) sources on commercial mass spectrometers.J Mass Spectrom. 2024 Jul;59(7):e5065. doi: 10.1002/jms.5065. J Mass Spectrom. 2024. PMID: 38866597
-
Applications of ambient ionization mass spectrometry in 2022: An annual review.Anal Sci Adv. 2023 Apr 26;4(5-6):133-153. doi: 10.1002/ansa.202300004. eCollection 2023 Jul. Anal Sci Adv. 2023. PMID: 38716065 Free PMC article. Review.
References
-
- Aebersold R., Agar J. N., Amster I. J., Baker M. S., Bertozzi C. R., Boja E. S., Costello C. E., Cravatt B. F., Fenselau C., Garcia B. A., Ge Y., Gunawardena J., Hendrickson R. C., Hergenrother P. J., Huber C. G., Ivanov A. R., Jensen O. N., Jewett M. C., Kelleher N. L., Kiessling L. L., Krogan N. J., Larsen M. R., Loo J. A., Ogorzalek Loo R. R., Lundberg E., Maccoss M. J., Mallick P., Mootha V. K., Mrksich M., Muir T. W., Patrie S. M., Pesavento J. J., Pitteri S. J., Rodriguez H., Saghatelian A., Sandoval W., Schlüter H., Sechi S., Slavoff S. A., Smith L. M., Snyder M. P., Thomas P. M., Uhlén M., Van Eyk J. E., Vidal M., Walt D. R., White F. M., Williams E. R., Wohlschlager T., Wysocki V. H., Yates N. A., Young N. L., Zhang B., Nat. Chem. Biol. 2018, 14, 206–214. - PMC - PubMed
-
- Parekh R. B., Rohlff C., Curr. Opin. Biotechnol. 1997, 8, 718–723. - PubMed
Publication types
MeSH terms
Substances
Grants and funding
LinkOut - more resources
Full Text Sources

