Reproducible, high-dimensional imaging in archival human tissue by multiplexed ion beam imaging by time-of-flight (MIBI-TOF)
- PMID: 35351966
- PMCID: PMC10357968
- DOI: 10.1038/s41374-022-00778-8
Reproducible, high-dimensional imaging in archival human tissue by multiplexed ion beam imaging by time-of-flight (MIBI-TOF)
Abstract
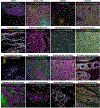
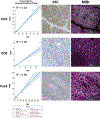
Multiplexed ion beam imaging by time-of-flight (MIBI-TOF) is a form of mass spectrometry imaging that uses metal labeled antibodies and secondary ion mass spectrometry to image dozens of proteins simultaneously in the same tissue section. Working with the National Cancer Institute's (NCI) Cancer Immune Monitoring and Analysis Centers (CIMAC), we undertook a validation study, assessing concordance across a dozen serial sections of a tissue microarray of 21 samples that were independently processed and imaged by MIBI-TOF or single-plex immunohistochemistry (IHC) over 12 days. Pixel-level features were highly concordant across all 16 targets assessed in both staining intensity (R2 = 0.94 ± 0.04) and frequency (R2 = 0.95 ± 0.04). Comparison to digitized, single-plex IHC on adjacent serial sections revealed similar concordance (R2 = 0.85 ± 0.08) as well. Lastly, automated segmentation and clustering of eight cell populations found that cell frequencies between serial sections yielded an average correlation of R2 = 0.94 ± 0.05. Taken together, we demonstrate that MIBI-TOF, with well-vetted reagents and automated analysis, can generate consistent and quantitative annotations of clinically relevant cell states in archival human tissue, and more broadly, present a scalable framework for benchmarking multiplexed IHC approaches.
© 2022. The Author(s), under exclusive licence to United States and Canadian Academy of Pathology.
Conflict of interest statement
Conflict of Interest
M.A. and S.C.B. are inventors on patents related to MIBI technology. M.A. and S.C.B. are consultants, board members and shareholders in Ionpath Inc.
Figures


Similar articles
-
A Hitchhiker's guide to high-dimensional tissue imaging with multiplexed ion beam imaging.Methods Cell Biol. 2024;186:213-231. doi: 10.1016/bs.mcb.2024.02.018. Epub 2024 Mar 10. Methods Cell Biol. 2024. PMID: 38705600 Free PMC article.
-
High-Dimensional Tissue Profiling by Multiplexed Ion Beam Imaging.Methods Mol Biol. 2022;2386:147-156. doi: 10.1007/978-1-0716-1771-7_10. Methods Mol Biol. 2022. PMID: 34766270
-
Multiplexed Ion Beam Imaging Readout of Single-Cell Immunoblotting.Anal Chem. 2021 Jun 22;93(24):8517-8525. doi: 10.1021/acs.analchem.1c01050. Epub 2021 Jun 9. Anal Chem. 2021. PMID: 34106685 Free PMC article.
-
Immunohistochemistry and mass spectrometry for highly multiplexed cellular molecular imaging.Lab Invest. 2015 Apr;95(4):397-405. doi: 10.1038/labinvest.2015.2. Epub 2015 Mar 2. Lab Invest. 2015. PMID: 25730370 Free PMC article. Review.
-
Mass Cytometry, Imaging Mass Cytometry, and Multiplexed Ion Beam Imaging Use in a Clinical Setting.Clin Lab Med. 2021 Jun;41(2):297-308. doi: 10.1016/j.cll.2021.03.008. Epub 2021 Apr 24. Clin Lab Med. 2021. PMID: 34020765 Review.
Cited by
-
Highly Multiplexed Tissue Imaging in Precision Oncology and Translational Cancer Research.Cancer Discov. 2024 Nov 1;14(11):2071-2088. doi: 10.1158/2159-8290.CD-23-1165. Cancer Discov. 2024. PMID: 39485249 Free PMC article. Review.
-
The burgeoning spatial multi-omics in human gastrointestinal cancers.PeerJ. 2024 Sep 13;12:e17860. doi: 10.7717/peerj.17860. eCollection 2024. PeerJ. 2024. PMID: 39285924 Free PMC article. Review.
-
Automated classification of cellular expression in multiplexed imaging data with Nimbus.bioRxiv [Preprint]. 2024 Jun 3:2024.06.02.597062. doi: 10.1101/2024.06.02.597062. bioRxiv. 2024. PMID: 38895405 Free PMC article. Preprint.
-
A Hitchhiker's guide to high-dimensional tissue imaging with multiplexed ion beam imaging.Methods Cell Biol. 2024;186:213-231. doi: 10.1016/bs.mcb.2024.02.018. Epub 2024 Mar 10. Methods Cell Biol. 2024. PMID: 38705600 Free PMC article.
-
Quantitative performance assessment of Ultivue multiplex panels in formalin-fixed, paraffin-embedded human and murine tumor specimens.Sci Rep. 2024 Apr 11;14(1):8496. doi: 10.1038/s41598-024-58372-5. Sci Rep. 2024. PMID: 38605049 Free PMC article.
References
-
- Thunnissen E, Borczuk AC, Flieder DB, Witte B, Beasley MB, Chung J-H, et al. The Use of Immunohistochemistry Improves the Diagnosis of Small Cell Lung Cancer and Its Differential Diagnosis. An International Reproducibility Study in a Demanding Set of Cases. Journal of Thoracic Oncology 12, 334–346 (2017) - PubMed
Publication types
MeSH terms
Substances
Grants and funding
LinkOut - more resources
Full Text Sources
Medical

