Characterizing cellular heterogeneity in chromatin state with scCUT&Tag-pro
- PMID: 35332340
- PMCID: PMC9378363
- DOI: 10.1038/s41587-022-01250-0
Characterizing cellular heterogeneity in chromatin state with scCUT&Tag-pro
Abstract
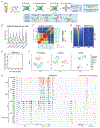
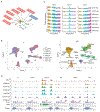
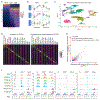
Technologies that profile chromatin modifications at single-cell resolution offer enormous promise for functional genomic characterization, but the sparsity of the measurements and integrating multiple binding maps represent substantial challenges. Here we introduce single-cell (sc)CUT&Tag-pro, a multimodal assay for profiling protein-DNA interactions coupled with the abundance of surface proteins in single cells. In addition, we introduce single-cell ChromHMM, which integrates data from multiple experiments to infer and annotate chromatin states based on combinatorial histone modification patterns. We apply these tools to perform an integrated analysis across nine different molecular modalities in circulating human immune cells. We demonstrate how these two approaches can characterize dynamic changes in the function of individual genomic elements across both discrete cell states and continuous developmental trajectories, nominate associated motifs and regulators that establish chromatin states and identify extensive and cell-type-specific regulatory priming. Finally, we demonstrate how our integrated reference can serve as a scaffold to map and improve the interpretation of additional scCUT&Tag datasets.
© 2022. The Author(s), under exclusive licence to Springer Nature America, Inc.
Conflict of interest statement
Competing interests:
In the past three years, R.S. has worked as a consultant for Bristol-Myers Squibb, Regeneron, and Kallyope and served as an SAB member for ImmunAI, Resolve Biosciences, Nanostring, and the NYC Pandemic Response Lab. P.S. is co-inventor of a patent related to this work. The other authors declare no competing interests.
Figures


Similar articles
-
Computational methods to explore chromatin state dynamics.Brief Bioinform. 2022 Nov 19;23(6):bbac439. doi: 10.1093/bib/bbac439. Brief Bioinform. 2022. PMID: 36208178 Free PMC article. Review.
-
Efficient chromatin accessibility mapping in situ by nucleosome-tethered tagmentation.Elife. 2020 Nov 16;9:e63274. doi: 10.7554/eLife.63274. Elife. 2020. PMID: 33191916 Free PMC article.
-
Multimodal chromatin profiling using nanobody-based single-cell CUT&Tag.Nat Biotechnol. 2023 Jun;41(6):794-805. doi: 10.1038/s41587-022-01535-4. Epub 2022 Dec 19. Nat Biotechnol. 2023. PMID: 36536148 Free PMC article.
-
Multifactorial profiling of epigenetic landscapes at single-cell resolution using MulTI-Tag.Nat Biotechnol. 2023 May;41(5):708-716. doi: 10.1038/s41587-022-01522-9. Epub 2022 Oct 31. Nat Biotechnol. 2023. PMID: 36316484 Free PMC article.
-
Scalable single-cell profiling of chromatin modifications with sciCUT&Tag.Nat Protoc. 2024 Jan;19(1):83-112. doi: 10.1038/s41596-023-00905-9. Epub 2023 Nov 7. Nat Protoc. 2024. PMID: 37935964 Free PMC article. Review.
Cited by
-
scNanoSeq-CUT&Tag: a single-cell long-read CUT&Tag sequencing method for efficient chromatin modification profiling within individual cells.Nat Methods. 2024 Oct 7. doi: 10.1038/s41592-024-02453-w. Online ahead of print. Nat Methods. 2024. PMID: 39375575
-
Deciphering breast cancer dynamics: insights from single-cell and spatial profiling in the multi-omics era.Biomark Res. 2024 Sep 18;12(1):107. doi: 10.1186/s40364-024-00654-1. Biomark Res. 2024. PMID: 39294728 Free PMC article. Review.
-
Emerging toolkits for decoding the co-occurrence of modified histones and chromatin proteins.EMBO Rep. 2024 Aug;25(8):3202-3220. doi: 10.1038/s44319-024-00199-2. Epub 2024 Aug 2. EMBO Rep. 2024. PMID: 39095610 Free PMC article. Review.
-
Integrated multi-omics with machine learning to uncover the intricacies of kidney disease.Brief Bioinform. 2024 Jul 25;25(5):bbae364. doi: 10.1093/bib/bbae364. Brief Bioinform. 2024. PMID: 39082652 Free PMC article. Review.
-
Single-cell omics: experimental workflow, data analyses and applications.Sci China Life Sci. 2024 Jul 23. doi: 10.1007/s11427-023-2561-0. Online ahead of print. Sci China Life Sci. 2024. PMID: 39060615 Review.
References
-
- Tang F et al. mRNA-Seq whole-transcriptome analysis of a single cell. Nat. Methods 6, 377–382 (2009). - PubMed
-
- Hashimshony T, Wagner F, Sher N & Yanai I CEL-Seq: single-cell RNA-Seq by multiplexed linear amplification. Cell Rep. 2, 666–673 (2012). - PubMed
-
- Picelli S et al. Smart-seq2 for sensitive full-length transcriptome profiling in single cells. Nat. Methods 10, 1096–1098 (2013). - PubMed
Publication types
MeSH terms
Substances
Grants and funding
LinkOut - more resources
Full Text Sources
Other Literature Sources

