TraSig: inferring cell-cell interactions from pseudotime ordering of scRNA-Seq data
- PMID: 35255944
- PMCID: PMC8900372
- DOI: 10.1186/s13059-022-02629-7
TraSig: inferring cell-cell interactions from pseudotime ordering of scRNA-Seq data
Abstract
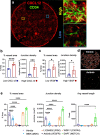
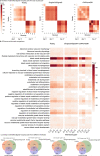
A major advantage of single cell RNA-sequencing (scRNA-Seq) data is the ability to reconstruct continuous ordering and trajectories for cells. Here we present TraSig, a computational method for improving the inference of cell-cell interactions in scRNA-Seq studies that utilizes the dynamic information to identify significant ligand-receptor pairs with similar trajectories, which in turn are used to score interacting cell clusters. We applied TraSig to several scRNA-Seq datasets and obtained unique predictions that improve upon those identified by prior methods. Functional experiments validate the ability of TraSig to identify novel signaling interactions that impact vascular development in liver organoids.Software https://github.com/doraadong/TraSig .
Keywords: Cell-cell interactions; Development; Gene expression.
© 2022. The Author(s).
Conflict of interest statement
M.R.E and J.J.V. have a patent (WO2019237124) for the organoid technology used in this publication.
Figures


Similar articles
-
scSTEM: clustering pseudotime ordered single-cell data.Genome Biol. 2022 Jul 7;23(1):150. doi: 10.1186/s13059-022-02716-9. Genome Biol. 2022. PMID: 35799304 Free PMC article.
-
LRT: Integrative analysis of scRNA-seq and scTCR-seq data to investigate clonal differentiation heterogeneity.PLoS Comput Biol. 2023 Jul 10;19(7):e1011300. doi: 10.1371/journal.pcbi.1011300. eCollection 2023 Jul. PLoS Comput Biol. 2023. PMID: 37428794 Free PMC article.
-
scReQTL: an approach to correlate SNVs to gene expression from individual scRNA-seq datasets.BMC Genomics. 2021 Jan 8;22(1):40. doi: 10.1186/s12864-020-07334-y. BMC Genomics. 2021. PMID: 33419390 Free PMC article.
-
Machine learning and statistical methods for clustering single-cell RNA-sequencing data.Brief Bioinform. 2020 Jul 15;21(4):1209-1223. doi: 10.1093/bib/bbz063. Brief Bioinform. 2020. PMID: 31243426 Review.
-
Over 1000 tools reveal trends in the single-cell RNA-seq analysis landscape.Genome Biol. 2021 Oct 29;22(1):301. doi: 10.1186/s13059-021-02519-4. Genome Biol. 2021. PMID: 34715899 Free PMC article. Review.
Cited by
-
Single-cell omics: experimental workflow, data analyses and applications.Sci China Life Sci. 2024 Jul 23. doi: 10.1007/s11427-023-2561-0. Online ahead of print. Sci China Life Sci. 2024. PMID: 39060615 Review.
-
The spatially resolved transcriptome signatures of glomeruli in chronic kidney disease.JCI Insight. 2024 Mar 22;9(6):e165515. doi: 10.1172/jci.insight.165515. JCI Insight. 2024. PMID: 38516889 Free PMC article.
-
The diversification of methods for studying cell-cell interactions and communication.Nat Rev Genet. 2024 Jun;25(6):381-400. doi: 10.1038/s41576-023-00685-8. Epub 2024 Jan 18. Nat Rev Genet. 2024. PMID: 38238518 Review.
-
Sctensor detects many-to-many cell-cell interactions from single cell RNA-sequencing data.BMC Bioinformatics. 2023 Nov 7;24(1):420. doi: 10.1186/s12859-023-05490-y. BMC Bioinformatics. 2023. PMID: 37936079 Free PMC article.
-
Adult tissue-specific stem cell interaction: novel technologies and research advances.Front Cell Dev Biol. 2023 Sep 21;11:1220694. doi: 10.3389/fcell.2023.1220694. eCollection 2023. Front Cell Dev Biol. 2023. PMID: 37808078 Free PMC article. Review.
References
-
- Hurley K, Ding J, Villacorta-Martin C, Herriges MJ, Jacob A, Vedaie M, Alysandratos KD, Sun YL, Lin C, Werder RB, et al. Reconstructed single-cell fate trajectories define lineage plasticity windows during differentiation of human PSC-derived distal lung progenitors. Cell Stem Cell. 2020;26(4):593–608. - PMC - PubMed
-
- Saelens W, Cannoodt R, Todorov H, Saeys Y. A comparison of single-cell trajectory inference methods. Nat Biotechnol. 2019;37(5):547–54. - PubMed
Publication types
MeSH terms
Grants and funding
LinkOut - more resources
Full Text Sources
Other Literature Sources

