. 2021 Nov;18(11):1352-1362.
doi: 10.1038/s41592-021-01264-7. Epub 2021 Oct 28.

Deep learning and alignment of spatially resolved single-cell transcriptomes with Tangram

Affiliations

Deep learning and alignment of spatially resolved single-cell transcriptomes with Tangram

Tommaso Biancalani et al. Nat Methods. 2021 Nov.

Abstract

Charting an organs' biological atlas requires us to spatially resolve the entire single-cell transcriptome, and to relate such cellular features to the anatomical scale. Single-cell and single-nucleus RNA-seq (sc/snRNA-seq) can profile cells comprehensively, but lose spatial information. Spatial transcriptomics allows for spatial measurements, but at lower resolution and with limited sensitivity. Targeted in situ technologies solve both issues, but are limited in gene throughput. To overcome these limitations we present Tangram, a method that aligns sc/snRNA-seq data to various forms of spatial data collected from the same region, including MERFISH, STARmap, smFISH, Spatial Transcriptomics (Visium) and histological images. Tangram can map any type of sc/snRNA-seq data, including multimodal data such as those from SHARE-seq, which we used to reveal spatial patterns of chromatin accessibility. We demonstrate Tangram on healthy mouse brain tissue, by reconstructing a genome-wide anatomically integrated spatial map at single-cell resolution of the visual and somatomotor areas.


Conflict of interest statement

A.R. is a cofounder and an equity holder of Celsius Therapeutics and an equity holder of Immunitas, and was a scientific advisory board member of ThermoFisher Scientific, Syros Pharmaceuticals, Neogene Therapeutics and Asimov. From 1 August 2020, A.R. has been an employee of Genentech. From 1 January 2021, G.S. has been an employee of Roche. From 1 February 2021, T.B. has been an employee of Genentech. X.Z. is a cofounder of and consultant for Vizgen.

Figures
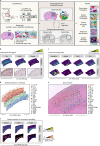
Fig. 1
Fig. 1. Tangram learns spatial transcriptome-wide patterns at single-cell resolution from sc/snRNA-seq data and corresponding spatial data.
a, Overview. sc/snRNA-seq data and spatial data, collected from the same tissue, are spatially aligned by comparing gene expression of their shared genes. bf, Tangram use cases. b, Generating genome-wide spatial patterns from gene signature data. Predicted expression patterns (color bar, normalized mRNA counts, see Methods) for each of three genes not included in an input smFISH dataset are validated against their corresponding images from the Allen ISH atlas (bottom). c, Correction of low-quality data for spatially measured genes. Predicted (top) and measured (bottom, by Visium) expression patterns (color bar, normalized mRNA counts, see Methods) of four known markers, the correct localization of which is missing in direct Visium measurements but recovered in the predicted patterns. d, Cell-type localization. Spatial distribution of cell types defined by snRNA-seq (legend) mapped on a smFISH brain slide. e, Single-cell deconvolution of lower-resolution Spatial Transcriptomics. Predicted single cells (colored dots, legend) in each Visium voxel (gray circle) based on snRNA-seq data mapped onto a Visium slide. f, Spatially resolved chromatin patterns. Predicted spatial gene expression (top, color bar, normalized mRNA counts, see Methods) and chromatin accessibility (bottom; color bar, normalized ATAC peak counts, see Methods) by mapping the RNA component of SHARE-seq data to a MERFISH slide.
Fig. 2
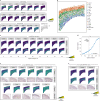
Fig. 2. Tangram maps cells with high-resolution MERFISH measurements and expands them to genome scale.
a, Probabilistic mapping of snRNA-seq data on MERFISH data. Probability of mapping (color bar) of each cell subset (gray label) in each of three major categories. Bottom right, schematic of key layers. b, Deterministic mapping. MERFISH slide with segmented cells (dot) colored by the cell-type annotation of the most likely snRNA-seq profile mapped on that position by Tangram (legend). c,d, Predicted expression of test genes. c, Measured (top) and Tangram-predicted (bottom) expression (color bar signifies fluorescence at top and normalized mRNA counts at bottom, see Methods) of select test gene (gray labels) with different extents of spatial correlation (bottom arrow, %) between measured and predicted patterns. d, Cumulative distribution function (CDF) of spatial correlation (x axis) between predicted and measured patterns for test genes. Dashed line: 75% of test genes are predicted with spatial correlation >40%. e, Predicted expression of test genes. Tangram-predicted (bottom) expression (top; color bar, normalized mRNA counts, see Methods) and corresponding ISH images from the Allen Brain Atlas (bottom) for 11 genes not measured by MERFISH. f, Correction of low-quality spatial measurements. MERIFSH measured (top), Tangram-predicted (middle) and Allen Brain Atlas ISH, for genes where predicted patterns differ from MERFISH measurement but match direct inspection of Allen ISH images (color bar, normalized mRNA counts, see Methods).
Fig. 3
Fig. 3. Correction of low-quality genes by mapping snRNA-seq on STARmap data.
a, Probabilistic mapping of snRNA-seq data on STARmap data. Probability of mapping (color bar) of each cell subset (gray label) in each of three major categories. b, Deterministic mapping. STARmap slide with segmented cells (dot) colored by the cell-type annotation of the most likely snRNA-seq profile mapped on that position by Tangram (legend). c, Measured (top) and Tangram-predicted (bottom) expression (color bar signifies fluorescence at top and normalized mRNA counts at bottom, see Methods) of select test gene (gray labels). d, Correction of low-quality spatial measurements. Tangram-predicted test genes (left), STARmap measurements (middle), and Allen atlas images (right) (color bar, normalized mRNA counts, see Methods) of four genes (gray labels) whose predicted patterns differ from STARmap measurement but match direct measurement by MERFISH. e, Predicted expression of test genes. Tangram-predicted (top) expression (top; color bar, normalized mRNA counts, see Methods) and corresponding ISH images from the Allen Brain Atlas (bottom) for six genes not measured by STARmap.
Fig. 4
Fig. 4. Mapping snRNA-seq data to Spatial Transcriptomics data (Visium) demonstrates deconvolution and imputation of dropouts.
a, Single-cell deconvolution. Predicted single cells (colored dots, legend) in each Visium voxel (gray circle) based on snRNA-seq data mapped onto a Visium slide. Cell assignment within a voxel is random with respect to the specific segmented cell. b, Probabilistic mapping of snRNA-seq data on the Visium ROI. Probability of mapping (color bar) of each cell subset (gray label) in each of three major categories. c,d, Predicted expression of test and training genes. c, Normalized (that is, unit area) distribution of single-gene spatial correlation coefficients (y axis) between Tangram-predicted and Visium-measured patterns in training (orange) and test (blue) genes. d, Reducing the number of training genes decreases prediction performance. Spatial correlation (y axis, top) for training genes (orange) and test genes (blue), and scaled spatial correlation (y axis, bottom) for test genes (scaled by the correlation averaged across training genes) for Tangram models learned with different fractions of 1,237 input training genes (x axis). eh, Impact of Visium data sparsity on prediction and correction. e, Tangram-predicted (top) and Visium-measured (bottom) expression (color bar, normalized mRNA counts, see Methods) of six select test genes (gray labels) with different extents of spatial correlation between measured and predicted patterns (top arrow, %) and of Visium data sparsity (bottom arrow, %). f, Spatial correlation of test genes is negatively correlated to sparsity in Visium data. Spatial correlation (y axis) between measured and predicted patterns for test genes (blue dots) and their corresponding measurement sparsity (x axis). Lines delineate three regions according to model performance. g, Few low-sparsity genes are not predicted well. Tangram-predicted (top) and Visium-measured (bottom) expression (color bar, normalized mRNA counts, see Methods) of four genes (gray labels) with low sparsity that are not well-predicted by model (from region (ii) of f). h, Correction of low-quality spatial measurements. Tangram-predicted (left), Visium (middle) and MERFISH (right) measurements (color bar signifies fluorescence for MERFISH figure, normalized mRNA counts for all others, see Methods), of two genes (gray labels) whose predicted patterns differ from Visium measurements but match direct measurement by MERFISH, and are highly sparse in Visium measurements (from region (iii) of f).
Fig. 5
Fig. 5. Tangram mapping of multi-omic SHARE-seq profiles yields spatial patterns of chromatin accessibility and transcription factor activity.
a, Probabilistic mapping of SHARE-seq profiles on MERFISH data. Probability of mapping (color bar) of each cell subset (gray labels) in each of three major categories based on the RNA component of SHARE-seq profiles. b, Deterministic mapping. MERFISH slide with segmented cells (dot) colored by the cell-type annotation of the most likely SHARE-seq (RNA) profile mapped on that position by Tangram (legend). c, Predicted chromatin-accessibility patterns. MERFISH-measured expression (top; color bar, normalized fluorescence, see Methods) and Tangram-predicted chromatin accessibility (bottom; color bar, normalized reads-in-peak count, see Methods) of select genes (gray labels). d, Predicted transcription factor activity patterns. Tangram-predicted expression (top; color bar, mRNA counts) and activity-normalized z-score patterns (as inferred from snATAC-Seq, see Methods) (bottom; color bar, dimensionless) of select genes (gray labels) measured only by SHARE-seq.
Fig. 6
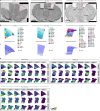
Fig. 6. Tangram mapping of snRNA-seq profiles to histological and anatomical mouse brain atlases.
a, ROIs. Nissl-stained images of coronal mouse brain slices highlighting the three regions of interest (anterior (left), mid (center), posterior (right)) from which snRNA-seq data from the motor area were collected. b,c, The registration pipeline generates anatomical region and cell-density maps. Anatomical region (b, color legend, from the Allen Common Coordinate Framework) and cell map (c, color bar, from the Blue Brain Cell Atlas) maps of each of the three dissected ROIs. d, Probabilistic mapping of snRNA-seq data on the ROI. Probability of mapping (color bar) of each cell subset (gray label) from each of three major categories within each ROI (rows).
Extended Data Fig. 1
Extended Data Fig. 1. Mapping results on Visium data are consistent across three datasets.
a. Consistent probabilistic maps across models trained from replicate datasets. Probability of mapping (color bar) of each cell subset (gray label) from each of 3 major categories in models trained separately from three Visium sections (rows). Section I is the same shown in Fig. 3b. b,c. Consistent deconvolution across models trained from replicate datasets. b. Fraction of cells (y axis) of each cell type (x axis) obtained after deconvolution with models trained separately by each of three Visium sections and in snRNA-seq. c. Predicted single cells (colored dots, legend) in each Visium voxel (grey circle) based on snRNA-seq data mapped onto Visium section 2 (left) and section 3 (right) (compare to Fig. 3b). Cell assignment within a voxel is random with respect to the specific segmented cell.
Extended Data Fig. 2
Extended Data Fig. 2. Tangram reveals structural organization in the mouse hypothalamus.
a. Registration pipeline identifies hypothalamus ROI on Visium section. Nissl-stained image of Section 1 from the Visium dataset (as in Fig. 4), marked with the hypothalamus ROI (light green) identified by our registration pipeline. b. Probabilistic mapping of whole mouse hypothalamus snRNA-seq to Visium hypothalamus ROI. Probability of mapping (color bar) of each cell type (grey labels; annotations as in) to the Visium hypothalamus ROI. c. Probabilistic maps recover neuronal sub-structures in the hypothalamus. Probability of mapping (color bar) of each inhibitory (GABA labels) and excitatory (Glu labels) neuron subsets. Annotations follow.
Extended Data Fig. 3
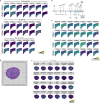
Extended Data Fig. 3. Cross-species mapping of human sc/snRNA-seq to mouse spatial data in brain and kidney.
a-c. Cross species probabilistic mapping between human primary motor cortex (MOp) snRNA-Seq, and mouse MOp MERFISH. a. Agreement in cell type patterning in human-mouse and mouse-mouse mapping. Probability of mapping (color bar) of each cell type (columns) in the cross species case (row label ‘Human’) versus the within-species case (row label ‘Mouse’; probability maps as in Fig. 2a). b. Quantitative comparison of cell type patterns between cross and within species mappings. Cosine similarity (blue dots) of cross-species and within-species probability maps for each cell type (labels). c. Similarities and differences of individual gene maps between cross and within species mappings. Gene expression (color bar, normalized mRNA counts, Methods) for various genes (horizontal labels) for the cross-species mapping (row label ‘Human’) and the within-species mapping (row label ‘Mouse’). d,e. Cross species probabilistic mapping between human kidney scRNA-Seq and mouse kidney Visium. d. Hematoxillin&Eosin (H&E)-stained image of a coronal section of mouse kidney on a Visium slide. e. Probability of mapping (color bar) of each human kidney cell type on the mouse Visium section.
Extended Data Fig. 4
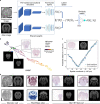
Extended Data Fig. 4. A Siamese network model learns a similarity metric for brain sections based on anatomical landmarks in mouse brain images.
a. Schematic of neural network architecture. A pair of images is fed to two convolutional encoders, which encode them into a 512-dimensional latent space. The image pair is labeled by the spatial coordinate (i.e., coronal depth) difference between the two images. b. The learned latent space is a 1D-manifold ordered by spatial coordinates. UMAP plot of the encoded training images from individual atlases (legend) colored by spatial depth (color bar). Insets illustrate four anatomically similar images from three different atlases and a test image. c. Prediction of spatial coordinates for a test image. c. Predicted spatial coordinate distance (y axis) between a test image (inset, left panel) and each image of the training set obtained at different spatial coordinates (x axis). Dashed orange line: ax+b fit via mean square error minimization (a~0.96,b~43). The minimum of the fit is the predicted spatial coordinate (associated image is in the inset, right panel). d. Examples of model predictions (right) on test images (left) from the Macosko lab (first column; Methods), BrainMaps atlas (second column) and Allen ISH dataset (third and fourth columns).
Extended Data Fig. 5
Extended Data Fig. 5. Anatomical region calling via semantic segmentation.
a. Neural network model used for semantic segmentation. A U-net model is trained on mouse brain images from Allen atlas (left) to recognize five different classes on a mouse brain image (color legend, right). b. Augmentation pipeline. Each image undergoes a series of stochastic transformations including affine displacements, dropouts and color shifts (Methods). Four training samples are shown. c. Schematic of registration strategy. A segmentation mask of an experimental image is produced (I), the mask of each atlas image is extracted in parallel (II), the two masks are registered to each other (III); and finally the learned transformation is used to register the original images (IV). d. Prediction examples. Test images (left) and their predicted anatomical region calls (right).
Extended Data Fig. 6
Extended Data Fig. 6. Post ROIs registration of Visium histology to the Allen Brain Atlas.
a. Histological image input. Nissl-stained mouse brain images used to map the Post ROI on the Allen Atlas (top; as in Fig. 6a) and on Visium (bottom; as in Fig. 4a). b. Mask registration. Histological images from (a) overlaid with the anatomical masks of matching region in the Allen CCFv3. Color legend for anatomical regions as in the Allen Brain Atlas). c. Post ROI. Sections (as in a) with anatomical labels (as in b) with the post ROI (light green area) identified on the Allen CCFv3 anatomical masks, as a result of registration.
Extended Data Fig. 7
Extended Data Fig. 7. Mouse motor cortex cell subsets based on snRNA-seq.
a. Cell clusters. UMAP embedding (Methods) of snRNA-seq profiles (dot) colored post hoc by cell type clusters (color legends with abbreviations; complete name in Extended Data Table 1). b. Cell subset specific markers. Distribution of normalized expression level (z-scores of logarithmic counts, color: median expression; Methods) for the two top marker genes (columns, bottom) of each cell type (rows; columns, top).

Comment in

Similar articles

Cited by

References

    1. Regev A, et al. The Human Cell Atlas. eLife. 2017;6:e27041. doi: 10.7554/eLife.27041. - DOI - PMC - PubMed
    1. Regev, A. et al. The Human Cell Atlas white paper. Preprint at https://arxiv.org/abs/1810.05192 (2018).
    1. Rozenblatt-Rosen O, Stubbington MJT, Regev A, Teichmann SA. The Human Cell Atlas: from vision to reality. Nature. 2017;550:451. doi: 10.1038/550451a. - DOI - PubMed
    1. Lähnemann D, et al. Eleven grand challenges in single-cell data science. Genome Biol. 2020;21:31. doi: 10.1186/s13059-020-1926-6. - DOI - PMC - PubMed
    1. Macosko EZ, et al. Highly parallel genome-wide expression profiling of individual cells using nanoliter droplets. Cell. 2015;161:1202–1214. doi: 10.1016/j.cell.2015.05.002. - DOI - PMC - PubMed

Publication types

LinkOut - more resources