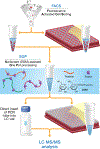
Facile One-Pot Nanoproteomics for Label-Free Proteome Profiling of 50-1000 Mammalian Cells
- PMID: 34351778
- PMCID: PMC8945255
- DOI: 10.1021/acs.jproteome.1c00403
Facile One-Pot Nanoproteomics for Label-Free Proteome Profiling of 50-1000 Mammalian Cells
Abstract
Recent advances in sample preparation enable label-free mass spectrometry (MS)-based proteome profiling of small numbers of mammalian cells. However, specific devices are often required to downscale sample processing volume from the standard 50-200 μL to sub-μL for effective nanoproteomics, which greatly impedes the implementation of current nanoproteomics methods by the proteomics research community. Herein, we report a facile one-pot nanoproteomics method termed SOPs-MS (
Keywords: SOPs-MS; colon crypt cells; nanoproteomics; small numbers of cells; surfactant DDM.
Conflict of interest statement
The authors declare no competing financial interest.
Figures


Similar articles
-
Surfactant-assisted one-pot sample preparation for label-free single-cell proteomics.Commun Biol. 2021 Mar 1;4(1):265. doi: 10.1038/s42003-021-01797-9. Commun Biol. 2021. PMID: 33649493 Free PMC article.
-
Robust Surfactant-Assisted One-Pot Sample Preparation for Label-Free Single-Cell and Nanoscale Proteomics.Methods Mol Biol. 2024;2817:85-96. doi: 10.1007/978-1-0716-3934-4_8. Methods Mol Biol. 2024. PMID: 38907149
-
Nanoparticle-Aided Nanoreactor for Nanoproteomics.Anal Chem. 2021 Aug 3;93(30):10568-10576. doi: 10.1021/acs.analchem.1c01704. Epub 2021 Jul 23. Anal Chem. 2021. PMID: 34297524 Free PMC article.
-
Advances in microscale separations towards nanoproteomics applications.J Chromatogr A. 2017 Nov 10;1523:40-48. doi: 10.1016/j.chroma.2017.07.055. Epub 2017 Jul 21. J Chromatogr A. 2017. PMID: 28765000 Free PMC article. Review.
-
Recent Technological Advances in the Mass Spectrometry-based Nanomedicine Studies: An Insight from Nanoproteomics.Curr Pharm Des. 2019;25(13):1536-1553. doi: 10.2174/1381612825666190618123306. Curr Pharm Des. 2019. PMID: 31258068 Review.
Cited by
-
Droplet-based proteomics reveals CD36 as a marker for progenitors in mammary basal epithelium.Cell Rep Methods. 2024 Apr 22;4(4):100741. doi: 10.1016/j.crmeth.2024.100741. Epub 2024 Apr 2. Cell Rep Methods. 2024. PMID: 38569541 Free PMC article.
-
[Applications of high performance liquid chromatography-mass spectrometry in proteomics].Se Pu. 2024 Jul;42(7):601-612. doi: 10.3724/SP.J.1123.2023.11006. Se Pu. 2024. PMID: 38966969 Free PMC article. Review. Chinese.
-
One-STAGE Tip Method for TMT-Based Proteomic Analysis of a Minimal Amount of Cells.ACS Omega. 2023 May 24;8(22):19741-19751. doi: 10.1021/acsomega.3c01392. eCollection 2023 Jun 6. ACS Omega. 2023. PMID: 37305273 Free PMC article.
-
Polymeric Nanoparticles and Nanogels: How Do They Interact with Proteins?Gels. 2023 Aug 6;9(8):632. doi: 10.3390/gels9080632. Gels. 2023. PMID: 37623087 Free PMC article. Review.
-
Protocol for generating high-fidelity proteomic profiles using DROPPS.STAR Protoc. 2024 Dec 20;5(4):103397. doi: 10.1016/j.xpro.2024.103397. Epub 2024 Oct 18. STAR Protoc. 2024. PMID: 39423124 Free PMC article.
References
-
- Mertins P; Mani DR; Ruggles KV; Gillette MA; Clauser KR; Wang P; Wang X; Qiao JW; Cao S; Petralia F; Kawaler E; Mundt F; Krug K; Tu Z; Lei JT; Gatza ML; Wilkerson M; Perou CM; Yellapantula V; Huang K.-l.; Lin C; McLellan MD; Yan P; Davies SR; Townsend RR; Skates SJ; Wang J; Zhang B; Kinsinger CR; Mesri M; Rodriguez H; Ding L; Paulovich AG; Fenyö D; Ellis MJ; Carr SA Proteogenomics connects somatic mutations to signalling in breast cancer. Nature 2016, 534, 55–62. - PMC - PubMed
-
- Zhang H; Liu T; Zhang Z; Payne SH; Zhang B; McDermott JE; Zhou J-Y; Petyuk VA; Chen L; Ray D; Sun S; Yang F; Chen L; Wang J; Shah P; Cha SW; Aiyetan P; Woo S; Tian Y; Gritsenko MA; Clauss TR; Choi C; Monroe ME; Thomas S; Nie S; Wu C; Moore RJ; Yu K-H; Tabb DL; Fenyö D; Bafna V; Wang Y; Rodriguez H; Boja ES; Hiltke T; Rivers RC; Sokoll L; Zhu H; Shih I-M; Cope L; Pandey A; Zhang B; Snyder MP; Levine DA; Smith RD; Chan DW; Rodland KD; Carr SA; Gillette MA; Klauser KR; Kuhn E; Mani DR; Mertins P; Ketchum KA; Thangudu R; Cai S; Oberti M; Paulovich AG; Whiteaker JR; Edwards NJ; McGarvey PB; Madhavan S; Wang P; Chan DW; Pandey A; Shih I-M; Zhang H; Zhang Z; Zhu H; Cope L; Whiteley GA; Skates SJ; White FM; Levine DA; Boja ES; Kinsinger CR; Hiltke T; Mesri M; Rivers RC; Rodriguez H; Shaw KM; Stein SE; Fenyo D; Liu T; McDermott JE; Payne SH; Rodland KD; Smith RD; Rudnick P; Snyder M; Zhao Y; Chen X; Ransohoff DF; Hoofnagle AN; Liebler DC; Sanders ME; Shi Z; Slebos RJC; Tabb DL; Zhang B; Zimmerman LJ; Wang Y; Davies SR; Ding L; Ellis MJC; Townsend RR Integrated Proteogenomic Characterization of Human High-Grade Serous Ovarian Cancer. Cell 2016, 166, 755–765. - PMC - PubMed
-
- Zhang B; Wang J; Wang X; Zhu J; Liu Q; Shi Z; Chambers MC; Zimmerman LJ; Shaddox KF; Kim S; Davies SR; Wang S; Wang P; Kinsinger CR; Rivers RC; Rodriguez H; Townsend RR; Ellis MJC; Carr SA; Tabb DL; Coffey RJ; Slebos RJC; Liebler DC Proteogenomic characterization of human colon and rectal cancer. Nature 2014, 513, 382–387. - PMC - PubMed

