. 2020 Dec 18;6(51):eabd7272.
doi: 10.1126/sciadv.abd7272. Print 2020 Dec.

RIPK3-mediated inflammation is a conserved β cell response to ER stress

Affiliations

RIPK3-mediated inflammation is a conserved β cell response to ER stress

Bingyuan Yang et al. Sci Adv. .

Abstract

Islet inflammation is an important etiopathology of type 2 diabetes; however, the underlying mechanisms are not well defined. Using complementary experimental models, we discovered RIPK3-dependent IL1B induction in β cells as an instigator of islet inflammation. In cultured β cells, ER stress activated RIPK3, leading to NF-kB-mediated proinflammatory gene expression. In a zebrafish muscle insulin resistance model, overnutrition caused islet inflammation, β cell dysfunction, and loss in an ER stress-, ripk3-, and il1b-dependent manner. In mouse islets, high-fat diet triggered the IL1B expression in β cells before macrophage recruitment in vivo, and RIPK3 inhibition suppressed palmitate-induced β cell dysfunction and Il1b expression in vitro. Furthermore, in human islets grafted in hyperglycemic mice, a marked increase in ER stress, RIPK3, and NF-kB activation in β cells were accompanied with murine macrophage infiltration. Thus, RIPK3-mediated induction of proinflammatory mediators is a conserved, previously unrecognized β cell response to metabolic stress and a mediator of the ensuing islet inflammation.


Figures

Fig. 1
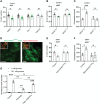
Fig. 1. Overnutrition leads to β cell loss in zMIR fish.
(A) Schematic of multiple sessions of overnutrition in zebrafish. Each session consisted of an 8-hour overnutrition treatment as indicated by the yellow rectangle and a 16-hour treatment in nutrient-free media as indicated by the white rectangle. Time 0 is the beginning of the first overnutrition session. (B) β cell number in fish challenged with multiple sessions of overnutrition. Data represent means ± SEM (n > 20 fish per time point). ***P < 0.001; two-way ANOVA, Tukey’s multiple comparisons test. (C to D′) Images of Tg(ins:H2BmCherry)-labeled β cells in control (C and D) and zMIR larvae (C′ and D′) at hours 56 and 72, respectively. Scale bars, 10 μm. (E) Whole-body free glucose content at hour 72. Data represent means ± SEM (n = 20 fish per group). *P < 0.05; one-way ANOVA, Tukey’s multiple comparisons test. (F) Insulin mRNA expression levels assessed by qRT-PCR in fish at hours 56 and 72. Data represent means ± SEM (n > 4 fish per group). *P < 0.05; one-way ANOVA, Tukey’s multiple comparisons test. ns, not significant. (G) Representative EM images of β cells at hour 64. Scales bar, 1 μm. (H) Quantification of granules per β cell section in islets from control and zMIR fish at hour 64. Data represent means ± SEM, n = 3 independent experiments. ***P < 0.001. (I) β cell number dynamics during the 16 hours of nutrient-free media from hours 56 to 72. Data represent means ± SEM (n > 25 fish per time point). ***P < 0.001; two-way ANOVA, Tukey’s multiple comparisons test. (J) Images of Tg(gcga:EGFP)-labeled α cells in the control and zMIR larvae at hour 72. (K) α cell number at hour 72 (n > 20 fish per group).
Fig. 2
Fig. 2. β cell loss requires Ripk3.
(A) β cell–protective effect of a RIPK1 inhibitor (Nec-1) and a RIPK3 inhibitor (GSK’872). Data represent means ± SEM (n > 15 per group). *P < 0.05; one-way ANOVA, Tukey’s multiple comparisons test. DMSO, dimethyl sulfoxide. (B) Requirement of ripk3 for the β cell loss. Data represent means ± SEM (n > 10 per group). *P < 0.05; one-way ANOVA, Tukey’s multiple comparisons test. (C) Maintenance of whole-body glucose content in ripk3−/−, zMIR larvae after three sessions of overnutrition. Data represent means ± SEM (n = 4 per group). *P < 0.05; one-way ANOVA, Tukey’s multiple comparisons test. (D) Punctate distribution of mutant RIPK3 in zMIR but not in non-zMIR β cells at hour 64. Scale bars, 5 μm. (E) Protective effect of β cell–specific inhibition of RIPK3 on β cells. Data represent means ± SEM (n > 25 per group). *P < 0.05; one-way ANOVA, Tukey’s multiple comparisons test. (F) Effect of β cell–specific inhibition of RIPK3 on whole-body free glucose content. Data represent means ± SEM (n = 4 per group). *P < 0.05; one-way ANOVA, Tukey’s multiple comparisons test. (G) GSK’872 prevents palmitate-impaired insulin secretion. Average insulin secretion per islet at 1 mM and 16.7 mM glucose from mouse islets treated with or without 0.5 mM palmitate in the presence or absence of 3 μM GSK’872. Data represent means ± SEM (n = 3 per group). **P ≤ 0.01 and ***P ≤ 0.001; two-way ANOVA, Tukey’s multiple comparisons test.
Fig. 3
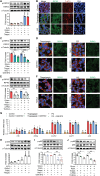
Fig. 3. ER stress activation of RIPK3 contributes to inflammation in mammalian β cells.
(A) Western blot analysis of the p-RIPK3 levels in MIN6 cells treated with different stress conditions. Data represent means ± SEM (n = 3 per group). ***P < 0.001; one-way ANOVA, Tukey’s multiple comparisons test. (B) Immunofluorescence analysis of RIPK3 distribution in MIN6 cells treated with different stress conditions. F-actin stain outlines individual cells. DNA stain labels nuclei. Scale bars, 10 μm. (C) Effects of Nec-1 and GSK’872 on thapsigargin- and GP-induced increase in p-RIPK3. Data represent means ± SEM (n = 3 per group). *P < 0.05, **P < 0.01, and ***P < 0.001; one-way ANOVA, Tukey’s multiple comparisons test. (D) Effects of Nec-1 and GSK’872 on the thapsigargin- and GP-induced increase in RIPK3 polymerization. Scale bars, 10 μm. (E) Effects of 4-PBA and TUDCA on the thapsigargin- and GP-induced increase in p-RIPK3. Data represent means ± SEM (n = 3 per group). **P < 0.01; one-way ANOVA, Tukey’s multiple comparisons test. (F) Effects of 4-PBA and TUDCA on the thapsigargin- and GP-induced increase in RIPK3 polymerization. Scale bars, 10 μm. (G) Effect of RIPK3 inhibition on the expression of proinflammatory genes in MIN6 cells. Bars labeled with a different letter are significantly different (P < 0.05), while those sharing a letter are not significantly different (P > 0.05). (H) Western blot analysis of p-p65 levels in MIN6 cells treated with different stress conditions. Data represent means ± SEM (n = 3 per group). ***P < 0.001; one-way ANOVA, Tukey’s multiple comparisons test. (I) Effects of Nec-1 and GSK’872 on the thapsigargin- and GP-induced increase in p-p65. Data represent *P < 0.05 and means ± SEM (n = 3 per group). **P < 0.01; one-way ANOVA, Tukey’s multiple comparisons test. (J) Effects of 4-PBA and TUDCA on the thapsigargin- and GP-induced increase in p-p65. Data represent means ± SEM (n = 3 per group). *P < 0.05 and **P < 0.01; one-way ANOVA, Tukey’s multiple comparisons test.
Fig. 4
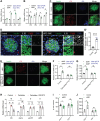
Fig. 4. RIPK3-dependent il1b induction is essential for β cell loss in zMIR fish.
(A) qRT-PCR analysis of candidate macrophage attractants in the islets at hour 64. Data represent means ± SEM (n = 4 per group). *P < 0.05; one-way ANOVA, Tukey’s multiple comparisons test. (B) qRT-PCR analysis of candidate macrophage attractants in the islets at hour 56. Data represent means ± SEM (n = 4 per group). *P < 0.05; one-way ANOVA, Tukey’s multiple comparisons test. (C) RNAscope analysis of insulin, il1b, and il8a at hour 64 in the control and zMIR fish. Scale bars, 10 μm. (D) Representative IL1B and F4/80 immunofluorescence images of control and 1-week HFD mouse pancreas sections (D′) and quantification of IL1B signal intensity in islet area. Scale bars, 20 μm. Inset scale bar, 5 μm. Data represent means ± SEM (n = 3 per group). ***P ≤ 0.001; one-way ANOVA, Tukey’s multiple comparisons test. (E) RNAscope analysis of insulin, il1b, and il8a at hour 64 in the zMIR and zMIR; Tg(ins: RIPK3D160N-GFP) fish. Scale bars, 10 μm. (F and G) Islet il1b expression and il8a by qRT-PCR. Data represent means ± SEM (n = 4 per group). *P < 0.05; one-way ANOVA, Tukey’s multiple comparisons test. (H) qRT-PCR analysis of mouse islets treated with the control medium or medium containing palmitate (0.5 mM) in the presence or absence of 3 μM GSK for 48 hours. *P < 0.05. (I) Requirement of il1b for β cell loss. Data represent means ± SEM (n > 9 per group). *P < 0.05; one-way ANOVA, Tukey’s multiple comparisons test. (J) Preservation of whole-body free glucose content in the il1b−/− zMIR larvae after three sessions of overnutrition. Data represent means ± SEM (n = 4 per group). *P < 0.05; one-way ANOVA, Tukey’s multiple comparisons test.
Fig. 5
Fig. 5. il1b induction is necessary for recruiting macrophage to the islet.
(A and B) Representative images from live imaging. Live control (A) or zMIR (B) fish were imaged for macrophages (green) and β cells (red) every 30 min starting at hour 64. (C to E) Representative images from the fixed control larvae (C and C′) and zMIR larvae (D to E′). A single confocal slice (C, D, and E) and the corresponding projection (C′, D′, and E′) of the islet are shown. The inset in (E) shows a macrophage surrounding a β cell. Scale bars, 10 μm. (F and F′) Requirement of Ripk3 for macrophage recruitment as shown by representative images (F) and distance between macrophage and nearest β cell (F′). Scale bars, 10 μm. Data represent means ± SEM (n = 10 per group). *P < 0.05; one-way ANOVA, Tukey’s multiple comparisons test. Mø stands for macrophage. (G and G′) Requirement of il1b for macrophage infiltration as shown by representative images (G) and by macrophage–to–β cell distance (G′) at hour 66. Scale bars, 10 μm. Data represent means ± SEM (n = 10 per group). ***P < 0.001; one-way ANOVA, Tukey’s multiple comparisons test.
Fig. 6
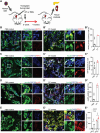
Fig. 6. The ER stress–RIPK3 inflammation axis is conserved in human β cells in vivo.
(A) Experimental design. (B to B*) Representative RIPK3 immunofluorescence images of human islet grafts from the PBS-treated (B) and DT-treated mice (B′) and (B*) and quantification of the percentage of β cells with the RIPK3 activation (B*). Data represent means ± SEM (n = 4 per group). ***P < 0.001; one-way ANOVA, Tukey’s multiple comparisons test. Scale bars, 20 μm. Inset scale bar, 5 μm. (C to C*) Representative RIPK3 and GRP78 immunofluorescence images of human islet grafts from the PBS-treated (C) and DT-treated mice (C′) and quantification of the percentage of β cells with the RIPK3 activation (C*). Data represent means ± SEM (n = 4 per group). ***P < 0.001; one-way ANOVA, Tukey’s multiple comparisons test. (D to D*) Representative GRP78 and p-p65 immunofluorescence images of human islet grafts from the PBS-treated (D) and DT-treated mice (D′) and quantification of the percentage of β cells with strong p-p65 signal (D*). Data represent means ± SEM (n = 4 per group). ***P < 0.001; one-way ANOVA, Tukey’s multiple comparisons test. (E to E*) Representative RIPK3 and F4/80 immunofluorescence images of human islet grafts from the PBS-treated (E) and DT-treated mice (E′) and quantification of the total and RIPK3-positive macrophages (E*). Data represent means ± SEM (n = 4 per group). ***P < 0.001; one-way ANOVA, Tukey’s multiple comparisons test. The transplants and human islets were part of a prior report (38), and sections of the graft were analyzed in the current study.

Similar articles

Cited by

References

    1. Cho N. H., Shaw J. E., Karuranga S., Huang Y., da Rocha Fernandes J. D., Ohlrogge A. W., Malanda B., IDF Diabetes Atlas: Global estimates of diabetes prevalence for 2017 and projections for 2045. Diabetes Res. Clin. Pract. 138, 271–281 (2018). - PubMed
    1. Halban P. A., Polonsky K. S., Bowden D. W., Hawkins M. A., Ling C., Mather K. J., Powers A. C., Rhodes C. J., Sussel L., Weir G. C., β-cell failure in type 2 diabetes: Postulated mechanisms and prospects for prevention and treatment. J. Clin. Endocrinol. Metab. 99, 1983–1992 (2014). - PMC - PubMed
    1. Petersen M. C., Shulman G. I., Mechanisms of insulin action and insulin resistance. Physiol. Rev. 98, 2133–2223 (2018). - PMC - PubMed
    1. Lytrivi M., Igoillo-Esteve M., Cnop M., Inflammatory stress in islet β-cells: Therapeutic implications for type 2 diabetes? Curr. Opin. Pharmacol. 43, 40–45 (2018). - PubMed
    1. Ying W., Lee Y. S., Dong Y., Seidman J. S., Yang M., Isaac R., Seo J. B., Yang B.-H., Wollam J., Riopel M., McNelis J., Glass C. K., Olefsky J. M., Fu W., Expansion of Islet-resident macrophages leads to inflammation affecting β cell proliferation and function in obesity. Cell Metab. 29, 457–474.e5 (2019). - PMC - PubMed

Publication types

LinkOut - more resources