. 2020 Dec;588(7839):670-675.
doi: 10.1038/s41586-020-3014-1. Epub 2020 Nov 25.

Progenitor identification and SARS-CoV-2 infection in human distal lung organoids

Affiliations

Progenitor identification and SARS-CoV-2 infection in human distal lung organoids

Ameen A Salahudeen et al. Nature. 2020 Dec.

Abstract

The distal lung contains terminal bronchioles and alveoli that facilitate gas exchange. Three-dimensional in vitro human distal lung culture systems would strongly facilitate the investigation of pathologies such as interstitial lung disease, cancer and coronavirus disease 2019 (COVID-19) pneumonia caused by severe acute respiratory syndrome coronavirus 2 (SARS-CoV-2). Here we describe the development of a long-term feeder-free, chemically defined culture system for distal lung progenitors as organoids derived from single adult human alveolar epithelial type II (AT2) or KRT5+ basal cells. AT2 organoids were able to differentiate into AT1 cells, and basal cell organoids developed lumens lined with differentiated club and ciliated cells. Single-cell analysis of KRT5+ cells in basal organoids revealed a distinct population of ITGA6+ITGB4+ mitotic cells, whose offspring further segregated into a TNFRSF12Ahi subfraction that comprised about ten per cent of KRT5+ basal cells. This subpopulation formed clusters within terminal bronchioles and exhibited enriched clonogenic organoid growth activity. We created distal lung organoids with apical-out polarity to present ACE2 on the exposed external surface, facilitating infection of AT2 and basal cultures with SARS-CoV-2 and identifying club cells as a target population. This long-term, feeder-free culture of human distal lung organoids, coupled with single-cell analysis, identifies functional heterogeneity among basal cells and establishes a facile in vitro organoid model of human distal lung infections, including COVID-19-associated pneumonia.


Conflict of interest statement

Competing interests C.J.K., A.A.S., S.S.C., C.A.B., A.R., M.R.A., M.M.-C., S.M.d.l.O. and T.U. are listed as inventors on provisional patent 63/053,079 describing the methods in this paper. C.J.K. is a founder of Surrozen Inc. All other authors declare no competing interests.

Figures

Extended Data Fig. 1 |
Extended Data Fig. 1 |. Optimization of human distal lung organoid culture.
a, Schematic of culture initiation from human distal lung. b, Brightfield microscopy evaluation of required exogenous growth factors and automated organoid quantitation after day 10 of chemically defined organoid culture with specified recombinant growth factors, N = Noggin, E = EGF, W = WNT3A, R = RSPO1, n = 4 per condition, data are mean ± s.e.m., * = P < 0.05, two-tailed student’s t-test, scale bar = 500 μm. c, Top, purification schema to isolate epithelial cells from distal human lung involving negative MACS bead depletion of CD45+ haematopoietic cells, endothelial cells and fibroblasts, followed by positive FACS selection for EPCAM+ epithelium. Bottom left, representative FACS demonstrating >99.9% EPCAM+ purity (orange) upon re-analysis versus unstained controls (grey). Bottom right, proliferation of EPCAM+ cells purified from distal lung cultures after day 10 of organoid culture with specified growth factors, N = Noggin, E = EGF, W = WNT3A, R = RSPO1, n = 3 per condition, data are mean ± s.e.m., ** = P < 0.01, two-tailed student’s t-test. d, Time lapse transmission confocal images of solid and cystic organoids originating from single dissociated human distal lung cells, scale bar = 100 μm. e-g, Clonality mixing studies. e, Schema of mixing studies of lentivirus-GFP- and lentivirus-mCherry-expressing cells to determine clonality. f, Representative live fluorescent imaging of resultant green and red organoids from (e), scale bar = 500 μm. g, Quantitation of red, green, or chimaeric, distal lung organoid cultures from two individuals (1, 2) after initial and serial passaging (P1 = passage 1).
Extended Data Fig. 2 |
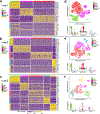
Extended Data Fig. 2 |. scRNA-seq of human distal lung organoids cultured from three individuals reveals reproducible basal, club, and AT2 populations.
a–c, Unsupervised clustering of total cell populations demonstrates consistency in top differentially expressed genes corresponding to basal (KRT5/6), club (SCGB1A1), and AT2 (SFTPC) cells. The epithelial fraction from these cultures ranged from approximately 90–99% of all cells with the remainder being either fibroblasts (VIM+) or mononuclear cells (HLA-DR+, likely alveolar macrophages). d–f, t-SNE visualization and violin plots for marker genes corresponding to each population. Note, a unique population enriched for SPRR genes, which have been described to mark squamous metaplasia, were exclusively found in the organoid culture of Lung 3, derived from an individual who was an active smoker.
Extended Data Fig. 3 |
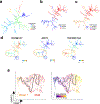
Extended Data Fig. 3 |. Trajectory inference with SPADE and pseudotime.
a, SPADE plot of pooled cells where each point represents cell states that are more related on the same or adjacent branches of a minimum spanning tree. Note: AT2 cells exist on a branch distal to basal and club cells, suggesting no lineage hierarchy between AT2, basal, and club cells. b, SPADE plots of pooled scRNA-seq samples after excluding AT2, VIM+ and HLA-DR+ cells support lineage relationships between basal (blue) and club (red) populations by club cell branches emanating from basal cells. c, SPADE plots of Basal 1, Basal 2, and club populations. d, Left, gene expression of SCGB1A1 shows higher expression in club versus basal cell lineages (left) as compared to KRT5 (middle). Right, median gene expression of TNFRSF12A, showing a high (orange outline) and a low (blue outline) within basal cell branches and inferring a potential lineage relationship. e, Monocle 3 pseudotime trajectory analysis of single cell transcriptomes of Basal 1 connected to club cells depicted with UMAP (cell number, n = 3,721), colored by (left) cell cluster and (right) pseudotime gradient.
Extended Data Fig. 4 |
Extended Data Fig. 4 |. Human AT2 organoid characterization.
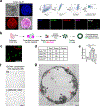
a, Left, confocal images of a live AT2 organoid at 67 days of culture labelled with Hoescht nuclear stain and LysoTracker Red DND-99. Top right, isolation of purified AT2 organoids. Representative FACS plots showing LysoTracker Red AT2 purification from unfractionated organoid cultures. Bottom right, immunostaining of cytospin of LysoTracker-sorted AT2 cells show high purity (100/100 cells SPC+ SCGB1A1 KRT5); scale bar = 50 μm). b, Schema of FACS isolation of AT2 cells from human mixed distal lung organoids as EPCAM+LysoTracker+ AT2 cells followed by long-term clonogenic organoid culture. c, Representative image of clonal mixing studies from stroma-depleted, EPCAM+LysoTracker+, lentivirally-marked AT2 cells demonstrating presence of completely mCherry+ or GFP+ but not chimaeric organoids carried out as in Extended Data Fig. 1e–g, passage 1 after lentiviral infection, scale bar = 200 μm. d, Quantitation of red, green, or chimaeric AT2 organoid cultures as in (c) from two individuals (1, 2) after initial and serial passaging (P1 = passage 1). e, AT2 organoid proliferation with differing combinations of recombinant niche factors and PORCUPINE inhibitor C59 (1 mM), NOGGIN (N), EGF (E), WNT3A (W), R-SPONDIN1 (R). n = 3 per condition, data are mean ± s.e.m., * = P < 0.05, *** = P < 0.001, two-tailed student’s t-test. f, Brightfield microscopy comparing pure AT2 organoid growth enhancement in chemically defined lung organoid media (EN) versus serum-containing L-cell conditioned media containing WNT3A, NOGGIN, and R-SPONDIN3 (L-WRN CM) supplemented with recombinant EGF, one experiment. Scale bar = 200 μm. g, Transmission electron microscopy image of representative AT2 organoid at 28 days of culture. Note apical microvilli (black arrows) and lamellar bodies (red arrows); scale bar = 10 μm.
Extended Data Fig. 5 |
Extended Data Fig. 5 |. Characterization of basal organoids.
a–c, Basal organoids in mixed culture progressively form internal lumens, which is not associated with apoptosis. a, KRT5 IF, day 26 culture, scale bar = 200 μm. b. Lumen quantitation, d12 versus d26 culture, single determination. c, Absence of apoptosis in d26 basal cell organoid internal lumen, cleaved caspase IF, from Fig. 2b, scale bar = 20 μm. d, e, Isolation of purified basal cell organoids via differential sedimentation in Ficoll. d, Schema and enrichment to >90% KRT5+ cells as measured by intracellular KRT5 FACS of sedimented basal organoid cells; scale bar = 100 μm. e, Serial time lapse microscopy of sedimented basal organoids reveals spontaneous cavitation within two weeks post passage or within four weeks of culture initiation; scale bar = 25 μm. f, g, Clonal mixing studies from stroma-depleted, Ficoll-purified and lentivirally-marked basal organoid cells demonstrating fully mCherry+ or GFP+ but not chimaeric organoids as in Extended Data Fig. 1f, passage 1 after lentiviral infection, scale bar = 200 μm. f, Representative clonal mixing image study. g, Quantitation. h, Growth factor evaluation for basal organoids after d14 sedimentation, enzymatic dissociation and clonogenic culture. Growth was not affected by the PORCUPINE inhibitor C59 (1 μM). n = 4 per condition, data are mean ± s.e.m., *** = P < 0.001, two-tailed student’s t-test.
Extended Data Fig. 6 |
Extended Data Fig. 6 |. scRNA-seq identifies an active basal cell subpopulation across three individual patient organoid cultures.
a, High resolution clustering analysis identifies a reproducible active basal cell subpopulation with significantly higher expression of mRNAs for TNFRSF12A, the NOTCH pathway marker HES1, and the proliferation marker MKI67. Modified Kruskal–Wallis Rank Sum Test two tail p-values: TNFRSF12A 4.15 × 10⁻⁸; HES1 2.4 × 10⁻¹⁰; MKI67 3.4 × 10⁻³. b, Fine resolution clustering of KRT5+ populations identifies two Basal 1 sub-clusters, Basal 1.1 and 1.2. c, Gene Ontology PANTHER overrepresentation of differentially expressed genes enriched in Basal 1.2 versus 1.1 show the majority of Basal 1.2 processes involve cell cycle (asterisks). Complete analysis is provided in Supplementary Table 3. d, Violin plot of scRNA-seq analysis for Fig. 2f–h depicting KRT5 mRNA expression among triply EPCAM+ITGA6+ITGB4+ mRNA-expressing single cells (purple, that is, tandem mRNA expression of all three genes) versus the remainder of cells (grey), P < 0.001 two tailed Kruskal–Wallis Rank Sum Test. e, t-SNE visualization of TNFRSF12A and ITGA6 expression from d among cells with EPCAM+ITGA6+ITGB4+ gene expression and subdivision by high (top quartile, orange), medium (pink) and low (bottom quartile, navy blue) mRNA expression. f, Proliferation-associated gene expression is progressively enriched for scRNA-seq cell fractions of in EPCAM+ITGA6+ITGB4+ cells that are stratified for low, medium, or high expression of TNFRSF12A mRNA as in e. Data in f represent cell population fractions from a single experiment. *** = P < 0.001, two tailed Chi-square test.
Extended Data Fig. 7 |
Extended Data Fig. 7 |. Evaluation of Basal 1 lineage relationship to Basal 2 and the influence of NOTCH signalling on Basal 1 renewal and differentiation.
a, Isolation of Basal 1 and Basal 2 via differential sedimentation of KRT5+ cells followed by FACS sorting of EPCAM+ITGA6+ITGB4+TNFRSF12A+ (Basal 1) versus EPCAMITGA6ITGB4TNFRSF12A (Basal 2). b, Intracellular FACS measurement of KRT5 protein expression in Basal 1 and 2 fractions from a. c, Representative brightfield of day 14 organoid cultures from a, b. d, Quantitation of 3 independent experiments from ac, box plot represents first quartile, median, third quartile, and whiskers represent minimum and maximum. *** P < 0.001, two tailed student’s t-test. e, qPCR measurement of two differentially upregulated Basal 2 genes from the three scRNA-seq biological replicates (Extended Data Fig. 6, SPRR1B, TMSB4X) after prolonged culture of FACS isolated Basal 1 cells. Data are relative mean ± s.e.m. of cultures from three independent experiments, ** = P < 0.01, two tailed student’s t-test. f, RNA FISH demonstrating TMSB4X and SPRR1B cellular transcripts within organoids originating from Basal 1 cells (arrows), scale bar = 25 μm. g, KRT5 immunostaining and SFTPC and SCGB1A1 RNA FISH of FACS isolated TNFRSF12Ahi Basal 1 cells under vehicle, NOTCH agonism (JAG1 peptide), or NOTCH antagonism with the Delta-like ligand mutant 4 (DLL4E12; E12) or the gamma secretase inhibitor DBZ; scale bar = 50 μm. h, Fluorescent quantitation of resazurin dye reduction to estimate relative cellular proliferation in g, data are normalized to vehicle (V) and represent mean ± s.e.m. from five independent experiments, * P < 0.05, two tailed student’s t-test. i, Quantitation of SCGB1A1 and SFTPC gene expression by RNA FISH in the context of NOTCH agonism or antagonism from three independent experiments, ** P < 0.01, *** P < 0.001, two tailed student’s t-test. SFTPC mRNA upregulation was not accompanied by lamellar body or SFTPC protein production (data not shown).
Extended Data Fig. 8 |
Extended Data Fig. 8 |. TNFRSF12A marks a subset of distal airway basal cells in vivo.
a, b, Immunostaining of KRT5 and TNFRSF12A in human distal airways from two individuals, scale bar = 100 μm. c, Immunostaining of KRT5, TNFRSF12A, and p63 in human distal airway, scale bar = 100 μm. d, FACS analysis from freshly fixed human distal lung with anti-KRT5 (intracellular) and monoclonal anti-TNFRSF12A (cell surface) (top), or sequential FACS isolation from freshly dissociated human distal lung of EPCAM+ITGA6+ITGB4+ cells followed by fractionation into TNFRSF12Ahi or TNFRSF12Aneg subsets (bottom), pre-gated on live singlets and used for culture experiments in Fig. 3d–g.
Extended Data Fig. 9 |
Extended Data Fig. 9 |. Influenza infection modelling in mixed distal lung organoid cultures.
a, b, Distal lung organoid modelling of H1N1 influenza infection. a, Merged transmission and GFP confocal images of purified basal (left) and purified AT2 organoids (right) 12 h after infection with PR8-GFP H1N1 influenza virus, quantified by FACS for % GFP+ cells. Bar plot represents the mean percentage of infected cells from three technical replicates, P = 0.57, Chi-square test. Scale bars = 50 μm. b, Viral genome quantitation over time of mixed distal lung organoid culture supernatants subjected to initial infection of wild-type H1N1 at an estimated multiplicity of infection (MOI) of 0.01, qRT–PCR, data represent the mean of three independent experiments ± s.e.m. c, d, Lectin staining with M. amurensis (a2–3) and S. nigra (a2–6) lectins or no lectin negative controls to characterize sialic acid residues which serve as surface molecules for influenza virus host cell entry. AT2 organoids (c) and basal organoids (d). Scale bar = 25 μm. e, Dose response curves for two different classes of antiviral drugs on influenza infectivity and replication. The nucleoside analogue FdC demonstrated dose dependent activity with IC50 of 340 nM as compared to neuraminidase inhibitor zanamivir, which only impairs viral shedding but not infectivity and replication. n = 3 per condition, data represents mean ± s.e.m. f, Fluorescence micrograph of multiwell screening of selected various antiviral agents after H1N1 PR8-GFP organoid infection in 48 well format. FdC = nucleoside analogue 2′-deoxy-2′-fluorocytidine. Cpd = compound #.
Extended Data Fig. 10 |
Extended Data Fig. 10 |. Apical-out polarization and multi-lineage differentiation of distal lung organoids upon suspension culture.
a, scRNA-seq plots of ACE2 and TMPRSS2 gene expression in ECM-embedded mixed distal lung organoids as in Fig. 1a–h. b, Diagram of ECM removal and suspension culture leading to apical-out polarity of lung organoids. c, Representative confocal microscopy showing reorganization of microfilaments (phalloidin) and acetylated microtubules (AcTUB) upon ECM removal. Scale bar = 10 μm. d–f, Polarization and accelerated ciliary differentiation of apical-out basal organoids. d, Confocal 3D sections (top panels) and surface reconstructions (bottom panels) of apical-out lung organoids at different days after ECM removal. At day 0 (d0) microfilament (green, phalloidin) and microtubule (red, acetylated tubulin) organization is not polarized while junctional strands (ZO-1, white) are polarized. By day 2 in suspension (d2) ZO-1 (white) forms junctional rings in the apical periphery of each cell facing the external side of the organoids and the actin cytoskeleton forms microvilli (green) facing outward (apical-out polarity). Also, at d2 some cells initiate microtubule polarization. By day 5 (d5) many more cells have motile cilia facing outwards. Mature motile cilia can be observed for several weeks, example at day 14 (d14). e, 3D confocal reconstruction of an organoid embedded in ECM consisting mostly of basal stem cells (KRT5+, white). f, As apical-out polarity is established in suspension culture and ciliogenesis begins, KRT5+ basal cells are found underneath the polarized epithelium. g, SCGB1A1+ Club cells with apical-out polarity are present on the exterior surface. In all panels nuclei are stained blue with DAPI, and actin microfilament organization visualized with phalloidin (green). Scale bars = 10 μm. h–j, Prolonged suspension culture of AT2 organoids (day 10 post-suspension) induces apical-out polarization and AT1 differentiation. h, Optical sections through alveolar-derived organoids after 10 days in suspension culture show decreased abundance of AT2 cells while individual cuboidal cells begin to express the AT1 marker HTI-56 (red), a transmembrane protein specific to the apical membrane of alveolar type 1 pneumocytes (AT1). Scale bars = 10 μm. i, j, Side views of alveolar organoids after 10 days of suspension culture reveal thin AT1 cells with phalloidin-reactive apical junctional complexes facing outwards (apical-out) (i) and expression of HTI-56 on the apical membrane (j). Scale bars = 10 μm. k, Representative confocal microscopy immunofluorescence of apical-out human basal organoid after 10 days in suspension expressing SARS-CoV-2 receptor ACE2 (green), cilia (AcTUB, red) and DAPI (blue). Scale bar = 20 μm.
Fig. 1 |
Fig. 1 |. Clonogenic expansion of human distal lung organoids.
a. Human distal lung D14 (day 14) organoid cultures contain cystic and solid organoids. Bottom left, brightfield; right, haematoxylin and eosin (H&E). Scale bar, 100 μm. b, Whole-mount immunofluorescence with anti-KRT5 (basal cell), anti-SFTPC (AT2 cell) and anti-SCGB1A1 (club cell) antibodies. Scale bar, 100 μm. ce, Alveolar organoids on D32. c, Cystic AT2 organoid. H&E; scale bar, 25 μm. d, Whole-mount immunofluorescence for anti-SFTPC, anti-HTII-280, phalloidin (Ph) and DAPI; scale bar, 50 μm. e, Anti-KI67 and DAPI fluorescence of an adjacent section to d. fh, Basal organoids on D32. f, H&E; scale bar, 50 μm. g, Whole-mount immunofluorescence for anti-KRT5 and DAPI; scale bar, 100 μm. h, Anti-KI67 and DAPI immunostaining of adjacent section to g. ik, Single-cell RNA-seq of total distal lung organoids at D28. i, t-Distributed stochastic neighbour embedding (t-SNE) plot of 7,285 individual cells demonstrating AT2, basal, and club populations. j, Expression of SFTPC (AT2), KRT5 (basal) and SCGB1A1 (club). k, Feature plots for expression of SFTPC (AT2), KRT5 (basal) and SCGB1A1 (club). lp, Clonogenic AT2 organoid culture. l, Brightfield microscopy of AT2 organoids at D180; scale bar, 200 μm. m, H&E staining from culture as in l; scale bar, 50 μm. n, Transmission electron microscopy of AT2 organoid at D32. LB, lamellar body; scale bar, 5 μm. o, p, Immunofluorescence of AT2 organoid at D32 (o); culture on glass for 10 additional days induces differentiation into AT1 cells (p). Immunofluorescence for anti-HTI-56 (AT1) and anti-HTII-280 (AT2); scale bar, 50 μm. q, scRNA-seq feature plots of 2,780 AT2 organoid cells on D89 of cumulative culture.
Fig. 2 |
Fig. 2 |. Basal organoid differentiation and TNFRSF12Ahi progenitor discovery.
a, b, Immunofluorescence showing basal organoid differentiation in mixed culture. Lumens are lined with acetylated tubulin+ (AcTUB) ciliated cells, which express the SARS-CoV-2 receptor ACE2 but lack KRT5 (a), and SCGB1A1+ club cells (b). Scale bar, 20 μm. ce, Sedimented basal organoid culture. c, Club cell differentiation in purified basal organoids after 38 days in 3D clonogenic culture, shown by whole-mount fluorescence for anti-SCGB1A1 (red), phalloidin (white), and DAPI (blue); scale bar, 50 μm. d, Ciliated differentiation of organoids as in c. Confocal transmission image; scale bar, 20 μm. White box in inset expanded to main image; arrowheads denote cilia. e, Immunofluorescence showing AcTUB+ ciliated and SCGB1A1+ club cells in an organoid that has been replated in 2D ALI culture. Scale bar, 50 μm. f, g, Single-cell RNA-seq of KRT5+ basal cells from Fig. 1i. f, t-SNE plots showing Basal 1 and Basal 2 subclusters. Basal 1 is subdivided into Basal 1.1 and 1.2, with the latter expressing the proliferative mRNAs CDK1 and PCNA. g, Differential gene expression in Basal 1 and Basal 2 subclusters from a total of 2,303 basal cells. h, Basal marker transcript t-SNE overlays of f (log10 number of unique molecular identifiers (UMI)). i, Relative gene expression kinetic plots of f and g across the pseudotime trajectory (n = 3,721 cells). j, FACS isolation of TNFRSF12Ahi versus TNFRSF12Aneg cells from mixed distal lung organoids, pre-gated on live singlets. k, Brightfield image of organoid culture of cells from j at D14. l, Quantification of k (number of organoids per 1,000 cells); ***P < 0.001 (P = 1.0 × 10⁻⁴), two-tailed Student’s t-test. Data in j, k represent n = 5 independent experiments for each TNFRSF12A population.
Fig. 3 |
Fig. 3 |. Characterization of TNFRSF12Ahi Basal 1 cells from intact human lung.
a, Left, anti-KRT5 and anti-TNFRSF12A immunofluorescence of human distal lung. Yellow boxed area is expanded with (middle) and without (right) DAPI. Scale bars, 100 μm. b, Immunofluorescence of distal airway TNFRSF12A+ basal cell proliferation showing KRT5, TNFRSF12A, KI67 and DAPI. Scale bar, 100 μm. c, Mitotic index of TNFRSF12A+KRT5+ cells from b; three independent experiments. K5+, total KRT5+; K5+T+, TNFRSF12A+KRT5+. Box plots represent first quartile, median and third quartile; whiskers show minimum and maximum. **P < 0.01 (P = 4.4 × 10⁻³), two-tailed Student’s t-test. d, Brightfield and anti-KRT5 immunofluorescence of FACS-isolated TNFRSF12Aneg and TNFRSF12Ahi organoid cultures at D14; scale bars, 500 μm. e, Quantification of d (number of organoids per 1,000 cells); data represent n = 5 independent experiments for each TNFRSF12A population. Box plots represent first quartile, median and third quartile; whiskers show minimum and maximum. P = 1.1 × 10⁻³, two-tailed Student’s t-test. f, H&E and anti-KRT5, anti-TNFRSF12A, anti-SCGB1A1, and anti-AcTUB immunostaining of organoids from the TNFRSF12Ahi fraction of FACS-sorted EPCAM+ITGA6+ITGB4+ distal lung cells. Scale bars, 50 μm. g, H&E and anti-SCGB1A1 and anti-AcTUB immunofluorescence of 2D ALI cultures from basal cell organoids from TNFRSF12Ahi basal cells as in f. Scale bars, 50 μm.
Fig. 4 |
Fig. 4 |. SARS-CoV-2 infection of apical-out distal lung organoids.
a, Immunofluorescence comparing polarization and surface localization of SCGB1A1+ club cells (green) and AcTUB+ ciliated cells (white) upon ECM-embedded non-polarized growth (left) or apical-out suspension culture (right). b, Transverse sections of apical-out basal organoid as in a stained with anti-ACE2, anti-SCGB1A1 and DAPI. c, Quantitative PCR for SARS-CoV-2 unspliced genomic RNA (gRNA, left) and spliced sgRNA (right) in apical-out distal lung organoids, 72 h post-infection (hpi), normalized to U3 snoRNA; n = 2 independent experiments. d, Anti-dsRNA immunofluorescence of apical-out human distal lung organoids, either mock-infected or infected with SARS-CoV-2, 48 hpi. e, Immunofluorescence for SARS-CoV-2 nucleocapsid protein (NP) in infected or mock-infected apical-out organoids at 96 hpi. f, Immunofluorescence of SARS-CoV-2-infected apical-out AT2 organoids with the indicated antibodies at 96 hpi. g, Immunofluorescence colocalization of SARS-CoV-2 NP and SCGB1A1 in apical-out distal lung basal organoids at 96 hpi. h, Immunofluorescence showing cell-type specificity in SARS-CoV-2-infected apical-out organoids. Inf, SARS-CoV-2 infected cell. In ch, organoids were in suspension for 6–10 days (basal) or 3 days (AT2) before infection. Scale bars, 20 μm except for f, h (10 μm).

Update of

Similar articles

Cited by

References

    1. Hogan B & Tata PR Cellular organization and biology of the respiratory system. Nat. Cell Biol. 10.1038/s41556-019-0357-7 (2019). - DOI - PubMed
    1. Rawlins EL et al. The role of Scgb1a1+ Clara cells in the long-term maintenance and repair of lung airway, but not alveolar, epithelium. Cell Stem Cell 4, 525–534 (2009). - PMC - PubMed
    1. Kathiriya JJ, Brumwell AN, Jackson JR, Tang X & Chapman HA Distinct airway epithelial stem cells hide among club cells but mobilize to promote alveolar regeneration. Cell Stem Cell 26, 346–358.e4 (2020). - PMC - PubMed
    1. Barkauskas CE et al. Type 2 alveolar cells are stem cells in adult lung. J. Clin. Invest. 123, 3025–3036 (2013). - PMC - PubMed
    1. Desai TJ, Brownfield DG & Krasnow MA Alveolar progenitor and stem cells in lung development, renewal and cancer. Nature 507, 190–194 (2014). - PMC - PubMed

Publication types

MeSH terms