Predictive modeling of single-cell DNA methylome data enhances integration with transcriptome data
- PMID: 33219054
- PMCID: PMC7849382
- DOI: 10.1101/gr.267047.120
Predictive modeling of single-cell DNA methylome data enhances integration with transcriptome data
Abstract
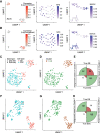
Single-cell DNA methylation data has become increasingly abundant and has uncovered many genes with a positive correlation between expression and promoter methylation, challenging the common dogma based on bulk data. However, computational tools for analyzing single-cell methylome data are lagging far behind. A number of tasks, including cell type calling and integration with transcriptome data, requires the construction of a robust gene activity matrix as the prerequisite but challenging task. The advent of multi-omics data enables measurement of both DNA methylation and gene expression for the same single cells. Although such data is rather sparse, they are sufficient to train supervised models that capture the complex relationship between DNA methylation and gene expression and predict gene activities at single-cell level. Here, we present methylome association by predictive linkage to expression (MAPLE), a computational framework that learns the association between DNA methylation and expression using both gene- and cell-dependent statistical features. Using multiple data sets generated with different experimental protocols, we show that using predicted gene activity values significantly improves several analysis tasks, including clustering, cell type identification, and integration with transcriptome data. Application of MAPLE revealed several interesting biological insights into the relationship between methylation and gene expression, including asymmetric importance of methylation signals around transcription start site for predicting gene expression, and increased predictive power of methylation signals in promoters located outside CpG islands and shores. With the rapid accumulation of single-cell epigenomics data, MAPLE provides a general framework for integrating such data with transcriptome data.
© 2021 Uzun et al.; Published by Cold Spring Harbor Laboratory Press.
Figures


Similar articles
-
Integrating Single-Cell Methylome and Transcriptome Data with MAPLE.Methods Mol Biol. 2023;2624:43-54. doi: 10.1007/978-1-0716-2962-8_4. Methods Mol Biol. 2023. PMID: 36723808
-
Simultaneous Profiling of mRNA Transcriptome and DNA Methylome from a Single Cell.Methods Mol Biol. 2019;1979:363-377. doi: 10.1007/978-1-4939-9240-9_21. Methods Mol Biol. 2019. PMID: 31028648
-
Integration of high-resolution methylome and transcriptome analyses to dissect epigenomic changes in childhood acute lymphoblastic leukemia.Cancer Res. 2013 Jul 15;73(14):4323-36. doi: 10.1158/0008-5472.CAN-12-4367. Epub 2013 May 30. Cancer Res. 2013. PMID: 23722552
-
Computational Methods for Single-cell DNA Methylome Analysis.Genomics Proteomics Bioinformatics. 2023 Feb;21(1):48-66. doi: 10.1016/j.gpb.2022.05.007. Epub 2022 Jun 17. Genomics Proteomics Bioinformatics. 2023. PMID: 35718270 Free PMC article. Review.
-
Mitotic inheritance of DNA methylation: more than just copy and paste.J Genet Genomics. 2021 Jan 20;48(1):1-13. doi: 10.1016/j.jgg.2021.01.006. Epub 2021 Feb 19. J Genet Genomics. 2021. PMID: 33771455 Review.
Cited by
-
scHiMe: predicting single-cell DNA methylation levels based on single-cell Hi-C data.Brief Bioinform. 2023 Jul 20;24(4):bbad223. doi: 10.1093/bib/bbad223. Brief Bioinform. 2023. PMID: 37302805 Free PMC article.
-
Advances in Multi-Omics Study of Prognostic Biomarkers of Diffuse Large B-Cell Lymphoma.Int J Biol Sci. 2022 Jan 9;18(4):1313-1327. doi: 10.7150/ijbs.67892. eCollection 2022. Int J Biol Sci. 2022. PMID: 35280688 Free PMC article. Review.
-
scSPLAT, a scalable plate-based protocol for single cell WGBS library preparation.Sci Rep. 2022 Apr 6;12(1):5772. doi: 10.1038/s41598-022-09798-2. Sci Rep. 2022. PMID: 35388090 Free PMC article.
-
Single-cell omics: experimental workflow, data analyses and applications.Sci China Life Sci. 2025 Jan;68(1):5-102. doi: 10.1007/s11427-023-2561-0. Epub 2024 Jul 23. Sci China Life Sci. 2025. PMID: 39060615 Review.
-
Technologies and applications of single-cell DNA methylation sequencing.Theranostics. 2023 Apr 23;13(8):2439-2454. doi: 10.7150/thno.82582. eCollection 2023. Theranostics. 2023. PMID: 37215576 Free PMC article. Review.
References
Publication types
MeSH terms
Grants and funding
LinkOut - more resources
Full Text Sources
