. 2019 Sep;37(9):1080-1090.
doi: 10.1038/s41587-019-0207-y. Epub 2019 Aug 19.

Immuno-SABER enables highly multiplexed and amplified protein imaging in tissues

Affiliations

Immuno-SABER enables highly multiplexed and amplified protein imaging in tissues

Sinem K Saka et al. Nat Biotechnol. 2019 Sep.

Abstract

Spatial mapping of proteins in tissues is hindered by limitations in multiplexing, sensitivity and throughput. Here we report immunostaining with signal amplification by exchange reaction (Immuno-SABER), which achieves highly multiplexed signal amplification via DNA-barcoded antibodies and orthogonal DNA concatemers generated by primer exchange reaction (PER). SABER offers independently programmable signal amplification without in situ enzymatic reactions, and intrinsic scalability to rapidly amplify and visualize a large number of targets when combined with fast exchange cycles of fluorescent imager strands. We demonstrate 5- to 180-fold signal amplification in diverse samples (cultured cells, cryosections, formalin-fixed paraffin-embedded sections and whole-mount tissues), as well as simultaneous signal amplification for ten different proteins using standard equipment and workflows. We also combined SABER with expansion microscopy to enable rapid, multiplexed super-resolution tissue imaging. Immuno-SABER presents an effective and accessible platform for multiplexed and amplified imaging of proteins with high sensitivity and throughput.


Conflict of interest statement

Competing Financial Interests. S.K.S., Y.W., J.Y.K., B.J.B., and P.Y. are inventors for provisional patent applications. P.Y. is a co-founder of Ultivue, Inc and NuProbe Global.

Figures

Figure 1.
Figure 1.. Immuno-SABER schematic.
(a) PER mechanism: (1) A 9-mer primer of sequence a binds to the single stranded a* sequence on the hairpin (* denotes complementarity). (2) The primer is extended by a strand displacing polymerase (e.g. Bst) isothermally and autonomously. The hairpin features a stopper sequence that halts polymerization, which releases the polymerase. (3) The newly synthesized a is displaced from the hairpin through branch migration. (4) The extended primer and the hairpin autonomously dissociate. (5) Repetition of this copy-and-release process produces a long concatemer of a. (b) Immuno-SABER schematic: (1a) Antibodies conjugated with bridge strands are used to simultaneously stain multiple targets. (1b) Primer sequences (green) are independently extended to a controlled length using PER. (2) Concatemers hybridize to the bridge sequence (blue) on the antibody. (3) Fluorophore (purple star)-labeled 20-mer DNA “imager” strands hybridize to the repeated binding sites on the concatemers. Each imager is designed to bind to a dimer of the unit primer sequence. (c) Exchange-SABER schematic: (1) Different biological targets (t.1 to t.n) are labeled with antibodies conjugated to orthogonal bridge strands (b.1 to b.n). (2) Orthogonal pre-extended concatemers are hybridized (via bridge complements b.1* to b.n*) to the bridge strands on the antibodies simultaneously. (3) Target t.1 is visualized by hybridization of imager i.1* to the i.1 sites on the concatemer bound to b.1 on the corresponding antibody, (4) Multiple targets can be imaged sequentially hybridization and dehybridization of orthogonal imagers in multiple rapid exchange cycles. (5) The images are computationally aligned and pseudo-colorized to overlay different targets.
Figure 2.
Figure 2.. Validation and quantification of signal amplification by Immuno-SABER.
(a) Cultured BS-C-1 cells were immunostained for alpha-tubulin and three conditions were prepared for comparison: Unamplified condition, where (i) unextended primers with single binding site for imager (with Alexa647) was hybridized to the bridge on the antibody, (ii) the extended concatemer was hybridized for signal amplification (linear amplification), (iii) conventional antibody staining was performed with Alexa647-conjugated secondary antibodies. (b) Representative images of each (max projections from confocal z-stack taken with a 63× objective). (c) Representative images for CD8a staining (labeled with Atto488-imager) in human tonsil FFPE sections (single plane large area scans with a 20× objective cropped to show a region of the CD8a+-cell rich interfollicular zone. (d) Cone arrestin staining in mouse retina cryosections (maximum projection of a confocal z-stack taken with a 20× objective). See Online Methods for experimental details. (e) Level of signal amplification by Immuno-SABER was quantified by measuring the background-subtracted mean fluorescence for several regions of interest in the tissues and expressed as fold amplification over unamplified signal level. Conventional secondary antibody amplification was also quantified similarly and shown as reference. For CD8a FFPEs, n = 80 (for unamplified), 100 (for SABER), 94 (for conventional) rectangular ROIs (each covering 0.03–1.20 mm2 tissue regions; consecutive tissue sections are used for the three conditions). For Cone arrestin, n = 6 images from 2 retina samples. Error bar indicates SEM. (f) Immuno-SABER was performed in whole-mount retina sections for Collagen IV and Vimentin. Maximum projections from confocal z-stacks are displayed.
Figure 3.
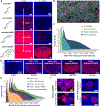
Figure 3.. Immuno-SABER signal can be further amplified through branching.
(a) Nuclear Ki-67 (Alexa647, red) imaging with DAPI (blue) in the Ki-67-rich germinal center of FFPE human tonsil sections shown with up to 3 rounds of amplification (iterative SABER). 16-bit images were scaled to two different maximum pixel values (500 and 30,000) to allow visual comparison. Signals were quantified in each case versus the unamplified sample and the fold changes are provided. (b) Machine-learning based contouring of the nuclei for quantification of signal per cell. See Supplementary Fig. 5a and Online Methods for more information. (c) Mean Ki-67 signal intensity for each nucleus was obtained from automated segmentation and the histogram was plotted for the whole tissue section for each condition. The consecutive sections each contain 636,479–717,176 identified nuclei. (d) Images show germinal centers in FFPE human tonsil sections with Ki-67 labeling (red) with conventional secondary antibody-fluorophore staining, with TSA (HRP-conjugated secondaries) for 2.5 and 7.5 min, with primary antibodies using iterative SABER amplification, or with secondary antibodies using branched SABER amplification. TSA was applied using poly-HRP conjugated secondary antibodies of a commercial SuperBoost Kit with 2.5 or 7.5 min tyramide-Alexa647 incubation. The amplification levels are noted below the images. (e) Histograms to visualize mean nuclear signal level were plotted for the conditions in panel d. The consecutive tissue sections each contain 586,183–717,176 cells. (f) Samples were imaged with a confocal microscope at higher resolution with 63× magnification to evaluate signal blurring. Images with different scaling are displayed in Supplementary Fig. 5f.
Figure 4.
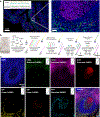
Figure 4.. Immuno-SABER and Exchange-SABER in FFPE human tonsil samples.
(a) Centimeter-scale whole-slide imaging of human tonsil sections with 5-color spectral multiplexing (DAPI + 4 targets). A zoom-in view of the region marked with the grey box showing 4-target imaging with subcellular resolution with a 20× objective and exposure times for each target (auto-exposure setting) is given at the bottom. For IgA and IgM (higher copy number), linear amplification yields high enough signal to achieve auto-exposure times of 1–20 ms under optimized conditions. For Ki-67 and CD8a (lower copy number), branched amplification (one round of branching) was applied to allow auto-exposure times of 2–10 ms. (b) Higher multiplexing via Exchange-SABER: The schematic for multiplexed imaging workflow where all antibodies are applied simultaneously, followed by simultaneous amplification, and sequential rounds of imaging. IgA and CD3e labeling structures are shown as examples to illustrate the workflow for linear and branched SABER on the same sample. c) Images show a zoom-in view of a germinal center in human FFPE tonsil sections imaged in 7-colors (DAPI + 6-targets) with a single exchange round (round 1: top row; round 2: bottom). 4 of the targets CD8a (Atto488), CD3e (Alexa647), Ki-67 (Alexa750) and PD-1 (Alexa750) were visualized with simultaneous branched SABER amplification, whereas IgA (Atto488) and IgM (Atto565) were visualized with linear amplification.
Figure 5.
Figure 5.. Exchange-SABER in mouse retina cryosections.
(a) 10 protein targets labeling various retinal cell types were visualized in 40 μm mouse retina cryosections. The markers targeted with Immuno-SABER were Rhodopsin (rod photoreceptors), GFAP (astrocytes), Vimentin (Muller cells), Collagen IV (blood vessels), three calcium binding proteins, VLP1, Calretinin (found in a subset of amacrine and ganglion cells) and Calbindin (note that although Calbindin was suggested to be also found in a subset of amacrine and ganglion cells, the Calbindin antibody used here mostly labels horizontal cells), and PKCα (blue cone cells and rod bipolar cells). The sections were first incubated with all DNA-conjugated antibodies simultaneously. All SABER concatemers were then added simultaneously to the sample, followed by washing and sequential incorporation of the imager strands and multi-round imaging. A z-stack of images was acquired for each target, and DAPI was imaged in every exchange cycle to monitor sample drift. The maximum projected images of each stack were computationally aligned using a subpixel registration algorithm using DAPI as the drift marker, and pseudo-colored for the overlay presentation. (b) Zoom-in view of the area marked by the white rectangle in a. Three cell subtypes (marked with arrows, I: VLP1+ and Calretinin+, II: VLP1 and Calretinin+, III: VLP1+ and Calretinin) can be differentiated based on VLP1 and Calretinin expression.
Figure 6.
Figure 6.. Multiplexed super-resolution imaging using Expansion-SABER.
(a) 40 μm mouse retina cryosections were stained for SV2 using DNA-conjugated SV2 antibodies, followed by SABER concatemer hybridization. Before and after images were respectively acquired before hydrogel formation, or after hydrogel formation and expansion (~3-fold), using the original expansion protocol,. (b) Images of pre- and post-synaptic sites of neuronal synapses in fixed primary mouse hippocampal neuron culture samples with and without expansion (different fields of view are shown). The pre-synaptic sites were labeled with anti-Bassoon antibodies and the post-synaptic sites were labeled with anti-Homer1 antibodies. DNA-conjugated secondary antibodies were used to target Bassoon and Homer1 primary antibodies, followed by SABER concatemers application. (c) ExM imaging of 6 protein targets in the originally 40 μm-thick mouse retina section (expanded ~3-folds) with Exchange-SABER. 2 exchange rounds with Atto488-, Atto565- and Alexa647- conjugated imager strands were performed to visualize all 6 targets in the expanded samples. DAPI was imaged in both rounds to serve as a registration marker. The images are maximum projections of z-stacks, drift-corrected using DAPI channels, and pseudo-colored for presentation. A zoom-in view of the boxed region is available in Supplementary Fig. 9b.

Similar articles

Cited by

References

    1. Angelo M et al. Multiplexed ion beam imaging of human breast tumors. Nat Med 20, 436–442 (2014). - PMC - PubMed
    1. Levenson RM, Borowsky AD & Angelo M Immunohistochemistry and mass spectrometry for highly multiplexed cellular molecular imaging. Lab Invest 95, 397–405 (2015). - PMC - PubMed
    1. Giesen CW, Schapiro HAO, D.; Zivanovic N; Jacobs A; Hattendorf B; Schüffler PJ; Grolimund D; Buhmann JM; Brandt S; Varga Z; Wild PJ; Günther D; Bodenmiller B Highly multiplexed imaging of tumor tissues with subcellular resolution by mass cytometry. Nature Methods 11, 417–425 (2014). - PubMed
    1. Wei L et al. Super-multiplex vibrational imaging. Nature 544, 465–470 (2017). - PMC - PubMed
    1. Gerdes MJ et al. Highly multiplexed single-cell analysis of formalin-fixed, paraffin-embedded cancer tissue. Proc Natl Acad Sci U S A 110, 11982–11987 (2013). - PMC - PubMed

Methods References

    1. Pierce MB & Dirks RM A Partition Function Algorithm for Nucleic Acid Secondary Structure Including Pseudoknots. J Comput Chem 24, 1664–1677 (2003). - PubMed
    1. Dirks RM & Pierce NA An algorithm for computing nucleic acid base-pairing probabilities including pseudoknots. J Comput Chem 25, 1295–1304 (2004). - PubMed
    1. Schindelin J et al. Fiji: an open-source platform for biological-image analysis. Nat Methods 9, 676–682 (2012). - PMC - PubMed
    1. Carpenter AE et al. CellProfiler: image analysis software for identifying and quantifying cell phenotypes. Genome Biol 7, R100 (2006). - PMC - PubMed
    1. Allan C et al. OMERO: flexible, model-driven data management for experimental biology. Nat Methods 9, 245–253 (2012). - PMC - PubMed

Publication types

LinkOut - more resources