. 2018 Aug 10;9(1):3196.
doi: 10.1038/s41467-018-05032-8.

A dormant TIL phenotype defines non-small cell lung carcinomas sensitive to immune checkpoint blockers

Affiliations

A dormant TIL phenotype defines non-small cell lung carcinomas sensitive to immune checkpoint blockers

S N Gettinger et al. Nat Commun. .

Abstract

The biological determinants of sensitivity and resistance to immune checkpoint blockers are not completely understood. To elucidate the role of intratumoral T-cells and their association with the tumor genomic landscape, we perform paired whole exome DNA sequencing and multiplexed quantitative immunofluorescence (QIF) in pre-treatment samples from non-small cell lung carcinoma (NSCLC) patients treated with PD-1 axis blockers. QIF is used to simultaneously measure the level of CD3+ tumor infiltrating lymphocytes (TILs), in situ T-cell proliferation (Ki-67 in CD3) and effector capacity (Granzyme-B in CD3). Elevated mutational load, candidate class-I neoantigens or intratumoral CD3 signal are significantly associated with favorable response to therapy. Additionally, a "dormant" TIL signature is associated with survival benefit in patients treated with immune checkpoint blockers characterized by elevated TILs with low activation and proliferation. We further demonstrate that dormant TILs can be reinvigorated upon PD-1 blockade in a patient-derived xenograft model.


Conflict of interest statement

In the last 12 months Dr. Kurt Schalper has been speaker or consultant for Merck, Takeda Pharmaceuticals, Shattuck Labs and Celgene. His laboratory has received research funding from Vasculox/Tioma, Navigate Biopharma, Tesaro Inc, Onkaido Therapeutics/Moderna, Takeda Pharmaceuticals and Surface Oncology. Dr. David Rimm is consultant or advisor to AstraZeneca, Agendia, Agilent, Biocept, Bristo-Myers-Squibb, Cell Signaling Technology. Cepheid, Merck, Optrascan, Perkinelmer and Ultivue. His laboratory has received research funding from AstraZeneca, Cepheid, Navigate/Novartis, NextCure, Gilead Sciences, Ultivue and Perkinelmer. Dr. Rimm also holds equity in PixelGear. Dr. Katerina Politi serves as consultant or advisor for AstraZeneca, Merck, Novartis and Tocagen. Her laboratory received research funds from AstraZeneca, Roche, Kolltan and Symphogen. Dr. Politi also holds royalties in IP licenced from Memorial Sloan Kettering Cancer Center to Molecular MD. Dr. Sarah Goldberg serves as consultant or advisor for AstraZeneca, Bristol-Myers Squibb, Lilly and Boehringer Ingelheim. She received research support from AstraZeneca. Lieping Chen serves as consultant or advisor for Pfizer, Vcanbio and GenomiCare. He is a scientific founder of NextCure and Tayu Biotech. His laboratory receives research funding from NextCure. The remaining authors declare no competing interests. with the content of this work.

Figures
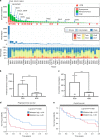
Fig. 1
Fig. 1
Association between mutations, candidate class-I neoantigens and benefit from immune checkpoint blockers in NSCLC. a Chart showing the number of somatic mutations (upper panel), candidate MHC class-I neoantigens (middle panel) and frequency of specific nucleotide substitution (lower panel); and association with DCB to immune checkpoint blockade (red star) in 49 NSCLC cases. The presence of mutations in genes associated with DNA repair is indicated with arrows over each case. The specific variant type is indicated within the chart. b, c Association between the mutational load (b) and predicted MHC class-I neoantigens. Error bars indicate S.E.M. ***P < 0.001, Mann–Whitney test. c With durable clinical benefit (DCB) and no durable benefit (NDB) to immune checkpoint blockade. The number of cases in each group is indicated in each bar. d, e Association between the mutational load and 3-year progression-free survival (d) and overall survival (e) after treatment with immune checkpoint blockers. The median mutational number was used as stratification cut point. The number of cases in each group and log-rank P value are indicated within each chart
Fig. 2
Fig. 2
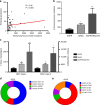
Experimental validation of predicted MHC class-I neoantigens detected in NSCLC. a Representative flow cytometry histogram showing the relative PE-Cy7 fluorescence of surface HLA-A2 in LCL-174 cells in the control condition (blue) or after incubation with recombinant MYO16 mutant neopeptide (red). (b) Distribution of stabilization signal scores for each recombinant neopeptide binding to HLA-A2 protein in LCL-174 cells. Scores are expressed a fold change relative to the signal obtained using the negative control. The data presented correspond to neoepitopes identified in three different tumor samples from one patient (primary tumor, metastasis, and recurrence). Each score obtained was averaged and a ratio was calculated respect to the average of the negative control peptide signal. Data in (a, b) is representative from two individual experiments. c FACS plot showing the levels of intracellular IFN-γ and TNF-α measured by flow cytometry in cultured CD8+ T-cells obtained from peripheral blood of the NSCLC patient after stimulation with artificial APCs and no peptide (left panel), a pool containing eight recombinant mutant neopeptides preincubated with mature autologous APCs (pool #1 relevant, center panel) and another pool of six mutant neopeptides not preincubated with autologous APCs (pool #2 irrelevant, right panel). Data in (c) is representative from two replicate experiments
Fig. 3
Fig. 3
Association between the mutations, predicted MHC class-I neoantigens, major oncogenic drivers and tobacco consumption. a Association between the mutational load and the level of cigarette smoking in lung cancer patients treated with immune checkpoint blockers. R = Spearman’s rho rank correlation coefficient. b, c Charts showing the number of nonsynonymous mutations (b) or candidate HLA class-I and class-II neoantigens. c In lung tumors treated with immune checkpoint blockers harboring mutations in EGFR (N = 8), KRAS (N = 11) or lacking mutations in both oncogenes (N = 30). Error bars indicate S.E.M. *P < 0.05; **P < 0.01, Mann–Whitney test. d, e Frequency of the specific variants identified in NSCLCs with EGFR (d) and KRAS mutations (e) *Mann–Whitney P value < 0.05; **Mann–Whitney P value < 0.01
Fig. 4
Fig. 4
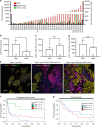
Association between local T-cell infiltration and activation/proliferation and benefit from immune checkpoint blockers in NSCLC. a Distribution of in situ CD3 (red, left Y axis), T-cell GZB (magenta, right Y axis) and T-cell Ki-67 signal (green, right Y axis) in lung tumors from patients treated with immune checkpoint blockers. bd Association between the level of CD3 (b), T-cell GZB (c), and T-cell Ki-67 (d) with durable clinical benefit (DCB) or no durable benefit (NDB) to immune checkpoint blockade. The number of cases in each group is indicated within each bar. NS = not significant with Mann-Whitney P > 0.05. *Mann–Whitney P value . Error bars indicate S.E.M. e Representative multiplexed fluorescence pictures showing lung tumors with a type 1 TIL pattern containing low CD3 level (left panel), a type 2 pattern with high CD3 but low T-cell GZB/Ki-67 (center panel); and a type 3 TIL phenotype with high CD3 and elevated T-cell GZB/Ki-67 (right panel). The color assigned to each marker is indicated within each caption. Bar = 100 μm.f, g Kaplan–Meier graphical analysis of 3-year progression free survival (f) and overall survival (g) of lung cancer cases treated with immune checkpoint blockers according to their TIL phenotype panel. The number of cases in each group and the log-rank P value is indicated in the chart
Fig. 5
Fig. 5
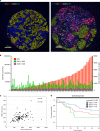
Association between local T-cell infiltration and activation/proliferation and survival in NSCLC patients not treated with immune checkpoint blockade. a Immunofluorescent staining of a lung tumor with low (a) and high (b) T-cell activation/proliferation. Slides were simultaneously stained with a multiplex QIF panel containing CD3 (red), Ki-67 (green), GZB (white), DAPI (blue), and cytokeratin (yellow). Bar = 100 μm. b Distribution of in situ CD3 (red, left Y axis), T-cell GZB (magenta, right Y axis) and T-cell Ki-67 signal (green, right Y axis) in lung tumors from patients not receiving immune checkpoint blockers. c Association between the level of T-cell GZB and T-cell Ki-67 in the cohort. R = Spearman’s correlation coefficient. The P value for the correlation is indicated within each chart. d Kaplan–Meier graphical analysis of 5-year overall survival of NSCLC cases not treated with immune checkpoint blockers according to their TIL activation subtypes. A type 1 TIL pattern was with low CD3, a type 2 pattern with high CD3 but low T-cell GZB/Ki-6; and a type 3 TIL phenotype with high CD3 and elevated T-cell GZB/Ki-67. The number of cases in each group and the log-rank P value is indicated in the chart
Fig. 6
Fig. 6
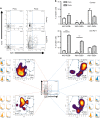
T-cell reinvigoration with PD-1 blocking antibodies. Surgically resected primary NSCLCs were engrafted subcutaneously in the flank of NOD-scid IL2rgc-/- mice. Mice were treated intraperitoneally with anti-hPD-1 mAbs (anti-PD-1) or PBS (Control) at days 5 and 10. At day 12 mice were sacrificed and tumor tissues were mechanically digested and single cells studied by mass cytometry. a, b Representative graphs depicting the levels of Ki-67 and GZB expression in TILs (CD3+) before engraftment (Pretx) and at the moment of sacrifice (Postx) in control and anti-PD-1 treated tumor-bearing mice. Dot plot a is representative of four experiments shown in (b). Error bars indicate S.E.M. **P < 0.01; ***P < 0.001, Mann–Whitney test. The number of independent experiments is indicated within the bars. c viSNE map of each biaxial plot of Ki-67 vs GZB quadrant. Three subpopulations were clustered using viSNE: CD4, CD8, and γδTCR T cells. Expression profile of each quadrant is depicted in small panels. Numbers indicate the median mass intensity for each marker. Expression of quadrant Ki-67-GZB- was used as a reference
Fig. 7
Fig. 7
Association between mutations and tumor immune infiltration and proliferation and cytolytic activity in NSCLC. a, b Association between the mutational load (a) or predicted class-I neoantigens (b) and specific TIL patterns found in lung tumors from patients treated with immune checkpoint blockers. NS = not significant with Mann–Whitney P > 0.05. c Chart showing the level of CD3 (white bars), T-cell GZB (black bars), and T-cell Ki-67 (gray bars) in lung tumors from patients treated with immune checkpoint blockers harboring mutations in EGFR (N = 8), KRAS (N = 11) or lacking mutations in both oncogenes (N = 30). Error bars indicate S.E.M. *P < 0.05; NS = not significant (P > 0.05), Mann–Whitney test. d, f Association between the mutational load and the level of CD3 (d), T-cell GZB (e), and T-cell Ki-67 (f) in lung cancer patients treated with immune checkpoint blockers. R = Spearman’s correlation coefficient. The P value for the correlation is indicated within each chart

Similar articles

Cited by

References

    1. Herbst RS, et al. Predictive correlates of response to the anti-PD-L1 antibody MPDL3280A in cancer patients. Nature. 2014;515:563–567. doi: 10.1038/nature14011. - DOI - PMC - PubMed
    1. Borghaei H, et al. Nivolumab versus docetaxel in advanced nonsquamous non-small-cell lung cancer. N. Engl. J. Med. 2015;373:1627–1639. doi: 10.1056/NEJMoa1507643. - DOI - PMC - PubMed
    1. Garon EB, et al. Pembrolizumab for the treatment of non-small-cell lung cancer. N. Engl. J. Med. 2015;372:2018–2028. doi: 10.1056/NEJMoa1501824. - DOI - PubMed
    1. Herbst RS, et al. Pembrolizumab versus docetaxel for previously treated, PD-L1-positive, advanced non-small-cell lung cancer (KEYNOTE-010): a randomised controlled trial. Lancet. 2016;387:1540–1550. doi: 10.1016/S0140-6736(15)01281-7. - DOI - PubMed
    1. Wolchok JD, et al. Nivolumab plus ipilimumab in advanced melanoma. N. Engl. J. Med. 2013;369:122–133. doi: 10.1056/NEJMoa1302369. - DOI - PMC - PubMed

Publication types

MeSH terms