. 2018 Sep;36(8):726-737.
doi: 10.1038/nbt.4184. Epub 2018 Jul 9.

A genetically encoded fluorescent acetylcholine indicator for in vitro and in vivo studies

Affiliations

A genetically encoded fluorescent acetylcholine indicator for in vitro and in vivo studies

Miao Jing et al. Nat Biotechnol. 2018 Sep.

Abstract

The neurotransmitter acetylcholine (ACh) regulates a diverse array of physiological processes throughout the body. Despite its importance, cholinergic transmission in the majority of tissues and organs remains poorly understood owing primarily to the limitations of available ACh-monitoring techniques. We developed a family of ACh sensors (GACh) based on G-protein-coupled receptors that has the sensitivity, specificity, signal-to-noise ratio, kinetics and photostability suitable for monitoring ACh signals in vitro and in vivo. GACh sensors were validated with transfection, viral and/or transgenic expression in a dozen types of neuronal and non-neuronal cells prepared from multiple animal species. In all preparations, GACh sensors selectively responded to exogenous and/or endogenous ACh with robust fluorescence signals that were captured by epifluorescence, confocal, and/or two-photon microscopy. Moreover, analysis of endogenous ACh release revealed firing-pattern-dependent release and restricted volume transmission, resolving two long-standing questions about central cholinergic transmission. Thus, GACh sensors provide a user-friendly, broadly applicable tool for monitoring cholinergic transmission underlying diverse biological processes.


Figures
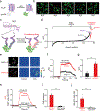
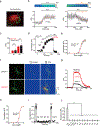
Figure 1
Figure 1. Development of GACh sensors.
(a) Schematic drawing shows the principle of the GPCR Activation Based ACh (GACh) sensor. (b) Membrane expression of the different MR-based candidate GACh sensors in HEK293T cells. The red arrow head indicates membrane localized signals. (c) Schematic drawing illustrates variants with one or multiple single-point mutations on the seven linker residues (total 18 hits). (d) Fluorescence responses of HEK293T cells expressing one of ~750 candidate GACh sensors harboring either randomized point or combinatorial mutations to the bath application of 100 μM ACh. Note ΔF/F0 of the combinatorial mutation-harboring GACh2.0 to be ~100% and data points are averaged responses of 2–10 cells. (e) Fluorescence responses of GACh1.0 and GACh2.0 expressing cells to the bath application of ACh. (f-g) ΔF/F0 of GACh1.0 and GACh2.0 expressing cells to ACh application (GACh1.0: 24.6 ± 1.5%, n = 19 cells from 5 cultures, GACh2.0: 90.1 ± 1.7%, n = 29 cells from 8 cultures, U = 551, p = 6.72E-9). (h) Fluorescence responses of HEK293T cells expressing either GACh2.0 or M1R-based FRET sensor to the application of ACh (100 μM). (i-j) Averaged ΔF/F0 or ΔFRET ratio (GACh2.0: 94.0 ± 3.0%, n = 10 cells from 2 cultures; FRET: 6.61 ± 0.4%, n = 10 cells from 2 cultures, U = 100, p = 1.09E-5) and SNR (GACh2.0: 60.0 ± 5.4, n = 10 cells from 2 cultures; FRET: 1.12 ± 0.21, n = 10 cells from 2 cultures, U = 100, p = 1.83E-4) of GACh2.0 and M1R-based FRET sensor expressing cells to ACh application. Data are shown with mean ± s.e.m, with error bars indicating s.e.m. Experiments in (b) and (e) were repeated independently for more than 5 cultures with similar results. ***, p < 0.001 (Mann-Whitney Rank Sum non-parametric tests, two-sides). All scale bars, 10 μm.
Figure 2
Figure 2. Characterization of GACh sensors in cultured HEK293T cells and neurons.
(a) Illustration of a fast perfusion system with a glass pipette filled with ACh and red Rhodamine-6G dye placed close to a GACh2.0 expressing cell. A white dash line indicates where the line scanning was performed. (b) Upper, scanning traces of fluorescence responses of GACh2.0 expressing cells to application of ACh and Tio. Lower, plot shows fluorescence values of on and off responses of a GACh2.0 expressing cell to the application of ACh or Tio, averaged from 3 different ROIs on the scanning line. The original data was processed with 16× binning and plotted. The white line indicates 0.5 s. (c) Averaged on and off time constants measured from the same (On: 233 ± 48 ms, n = 3 cells from 3 cultures; Off: 645 ± 90 ms, n = 3 cells from 3 cultures) and different (On: 279 ± 32 ms, n = 18 cells from 18 cultures; Off: 762 ± 75 ms, n = 11 cells from 11 cultures) cells. Note no statistic difference between the results obtained from the same and different cells (p = 0.80 for on kinetics, p = 0.64 for off kinetics). (d) Averaged responses (3 trials from the same cell) of a GACh2.0 expressing HEK293T cell to ACh application. Note blockade of the responses by muscarinic antagonist AF-DX 384. (e) Dose-dependent response plot of GACh2.0 expressing HEK293T cells to ACh application yielded pEC50 = −6.12 ± 0.11 M, or EC50 = 0.78 ± 0.25 μM, n = 4 cells from 4 cultures. (f) Confocal GFP fluorescent and pseudocolor images of GACh1.0 and GACh2.0 expressing cultured cortical neurons in the normal bath solution and solution containing 100 μM ACh. (g) Time course of the fluorescence response of GACh1.0 and GACh2.0 expressing cultured neurons (averaged from 3 independent trials of single neurons). (h) Dose-dependent responses of GACh2.0 expressing cultured neurons (pEC50 = −5.70 ± 0.01 M or EC50 = 1.99 ± 0.05 μM; n = 15 neurons from 15 cultures). (i) Responses of GACh2.0 expressing neurons to application of ACh and ACh-related compounds and other major neurotransmitters/modulators (averaged from 3 neurons in the same culture). (j) Values for normalized ΔF/F0 of GACh2.0 expressing cells to application of 100 μM ACh with 2 μM tiotropium (Tio), 50 μM Nicotine, 100 μM Choline, 10 μM Glycine (Gly), 1 μM 5-HT, 10 μM Epinephrine (Epi), 10 μM GABA, 10 μM Glutamate (Glu), 20 μM Dopamine (DA), 200 μM Norepinephrine (NE), 1000 μM Histamine (His), 1 μM Adenosine (Ade) compared to application of ACh alone (ACh: 100.65 ± 7.61%, n = 14 ROIs with >10 cells each ROI; ACh+Tio: 0.19 ± 1.53%, n = 14 ROIs, U = 196, p = 7.47E-6; Nicotine: 0.32 ± 1.47%, n = 15 ROIs, U = 210, p = 5.10E-6; Choline: −1.46 ± 2.31%, n = 15 ROIs, U = 210, p = 5.10E-6; Glycine: −1.36 ± 1.58%, n = 13 ROIs, U = 182, p = 1.13E-5; 5-HT: 0.96 ± 1.11%, n = 15 ROIs, U = 210, p = 5.10E-6; Epi: −0.77 ± 1.35%, n = 14 ROIs, U = 196, p = 7.47E-6; GABA: −2.01 ± 1.11%, n = 15 ROIs, U = 210, p = 5.10E-6; Glu: −0.49 ± 1.45%, n = 16 ROIs, U = 224, p = 3.57E-6; DA: −0.83 ± 1.20%, n = 15 ROIs, U = 210, p = 5.10E-6; NE: −0.42 ± 1.63%, n = 12 ROIs, U = 168, p = 1.75E-5; His: −4.54 ± 0.66%, n = 11 ROIs, U = 154, p = 2.81E-5; Ade: −2.23 ± 1.05%, n = 16 ROIs, U = 224, p = 3.57E-6. Data are shown with mean ± s.e.m, with error bars indicating s.e.m. *, p < 0.05; **, p < 0.01; ***, p < 0.001; n.s., not significant (Mann-Whitney Rank Sum non-parametric tests, two-sides). All scale bars, 10 μm.
Figure 3
Figure 3. GACh2.0 detects rapid ACh application in brain slices.
(a) Schematic drawing outlines the design of simultaneous imaging and electrophysiological recording experiments in mouse cultured hippocampal slice preparation. Left insets show transmitted light (top), fluorescence microscopic (bottom) images of a pair of simultaneously recorded GACh2.0 expressing and neighboring control non-expressing CA3 neurons. Right insets show the biocytin-filled and reconstructed GACh2.0 expressing and non-expressing CA3 neurons. (b) Left, simultaneous fluorescence and current responses of the pair of GACh2.0 expressing and neighboring control non-expressing CA3 neurons to a brief puff (500 ms) application of 100 mM acetylcholine (ACh). Right, the responses in the left rectangle box are shown again in an expanded time scale. (c) Values for the cholinergic fluorescence responses of GACh2.0 expressing CA3 neurons compared to non-expressing neurons (GACh2.0: 0.68 ± 0.08%; Ctrl: 0.14 ± 0.01%; Z = 4.015; p = 0.0005; n = 21 neurons from 9 animals). (d) Values for the amplitudes of fast cholinergic current responses (GACh2.0: 180.9 ± 30.8 pA; Ctrl: 181.2 ± 28.4 pA; Z = −0.037; p = 0.97; n = 21 from 9 animals) and slow cholinergic current responses (GACh2.0: 76.2 ± 15.9 pA; Ctrl: 76.8 ± 17.0 pA; Z = 0.896; p = 0.37; n = 21 neurons from 9 animals) in GACh2.0 expressing CA3 neurons compared to non-expressing neurons. (e) Values for the latencies of cholinergic current responses in non-expressing CA3 neurons (Ctrl: 611 ± 10 ms; Z = 0.523; p = 0.60) and GACh2.0 expressing (GACh2.0: 622 ± 12 ms; Z = 0.485; p = 0.62) compared to those of fluorescence responses of GACh2.0 expressing neurons (GACh2.0: 580 ± 9 ms; n = 21 neurons from 9 animals). (f) Values for the signal-to-noise ratio (SNR) of cholinergic fluorescence responses of GACh2.0 expressing CA3 neurons compared to non-expressing neurons (GACh2.0: 14.0 ± 1.5; Ctrl: 1.0 ± 0.1; Z = 3.408; p = 0.001; n = 15 neurons from 6 animals), and that of fast (GACh2.0: 36.2 ± 7.7; Ctrl: 34.6 ± 5.7; Z = 0.170; p = 0.86; n = 15 neurons from 6 animals) and slow (GACh2.0: 7.5 ± 1.0; Ctrl: 9.0 ± 1.0; Z = −0.852; p = 0.39; n = 15 neurons from 6 animals) cholinergic current responses of GACh2.0 expressing CA3 neurons compared to non-expressing neurons. Note that SNR of cholinergic fluorescence responses of GACh2.0 expressing CA3 neurons is smaller than fast (GACh2.0: Z = 2.242; p = 0.015; Ctrl: Z = 3.124; p = 0.002), but larger than slow (GACh2.0: Z = −2.840; p = 0.005; Ctrl: Z = −2.669; p = 0.008) cholinergic current responses of GACh2.0 expressing CA3 neurons compared to non-expressing neurons. (g) Values for the two fluorescence responses of non-expressing (1st: 0.11 ± 0.01%; 2nd: 0.11 ± 0.01%; Z = −0.142; p = 0.89; n = 17 neurons from 9 animals) and GACh2.0 expressing (1st: 1.01 ± 0.11%; 2nd: 0.94 ± 0.09%; Z = −1.138; p = 0.26; n = 17 neurons from 9 animals) CA3 neurons. (h) Values for the two fast cholinergic current responses in non-expressing (1st: 190.9 ± 26.1 pA; 2nd: 124.1 ± 20.4 pA; Z = −3.296; p = 0.001; n = 17 neurons from 9 animals) and GACh2.0 expressing (1st: 203.8 ± 34.9 pA; 2nd: 119.3 ± 18.6 pA; Z = −2.856; p = 0.004; n = 17 neurons from 9 animals) CA3 neurons, and values for the two slow cholinergic current responses of non-expressing (1st: 56.4 ± 13.4 pA; 2nd: 39.0 ± 5.7 pA; Z = −2.166; p = 0.003; n = 17 neurons from 9 animals) and GACh2.0 expressing (1st: 41.6 ± 4.5 pA; 2nd: 41.7 ± 6.8 pA; Z = 0.940; p = 0.93; n = 17 neurons from 9 animals) CA3 neurons. Data are shown with mean ± s.e.m, where large black dots indicate mean response, error bars indicate s.e.m. *, p < 0.05 (Wilcoxon tests, two-sides).
Figure 4
Figure 4. GACh2.0 reveals firing pattern-dependent restricted volume transmission in MEC.
(a) Schematic drawing outlines the design of stimulation-imaging experiments in mouse MEC preparation. (b) Snapshots of fluorescence responses of a GACh2.0 expressing stellate cell to local electrical stimuli. (c) Relative fluorescence responses of the GACh2.0 expressing stellate cell to local electrical stimuli shown in a heat map format. (d) Fluorescence responses of a GACh2.0 expressing MEC stellate neuron to repetitive layer 1 electrical stimulation every 8 minutes. (e) Values for the subsequent fluorescence responses of GACh2.0 MEC stellate neurons to the multiple layer 1 electrical stimulation at time interval of 8 min (2nd: 1.58 ± 0.15%, Z = −0.534; p = 0.59; 3rd: 1.65 ± 0.25%, Z = −0.178; p = 0.86; 4th: 1.62 ± 0.25%, Z = 0.222; p = 0.82; 5th: 1.61 ± 0.22%, Z = 0.051; p = 0.96; 6th: 1.55 ± 0.23%, Z = −0.800; p = 0.42; n = 11 neurons from 7 animals) compared to the first fluorescence response (1st: 1.63 ± 0.16%). (f) Fluorescence responses of a GACh2.0 expressing MEC stellate neuron to electrical stimuli consisting of a train of 20 pulses at varied frequency. (g) Values for the peak fluorescence responses of GACh2.0 expressing MEC stellate neurons to electrical stimulations consisting of a train of 20 pulses at higher frequency (1 Hz: 1.75 ± 0.47%, Z = 2.606; p = 0.009; 2 Hz: 1.74 ± 0.53%, Z = 1.726; p = 0.08; 4 Hz: 1.19 ± 0.44%, Z = −1.746; p = 0.140; 8 Hz: 0.82 ± 0.22%, Z = −3.107; p = 0.002; 16 Hz: 0.53 ± 0.12%, Z = −3.296; p = 0.001; 32 Hz: 0.29 ± 0.06%, Z = −3.296; p = 0.001; n = 14 neurons from 9 animals) compared to the lowest frequency tested (0.5 Hz: 1.34 ± 0.30%). (h) Values for 10–90% rise time of the fluorescence responses of GACh2.0 expressing MEC stellate neurons to electrical stimulations consisting of a train of 20 pulses at higher frequency (1 Hz: 8.1 ± 1.5 s, Z = 1.859; p = 0.06; 2 Hz: 6.2 ± 1.1 s, Z = 0.001; p = 0.99; 4 Hz: 3.8 ± 0.3 s; Z = −2.197; p =0.028; 8 Hz: 2.4 ± 0.3 s, Z = −2.366; p = 0.018; 16 Hz: 2.1 ± 0.3 s, Z = −2.366; p = 0.018; n = 7 neurons from 5 animals) compared to the lowest frequency tested (0.5 Hz: 6.5 ± 0.9 s), and values for decay time constant of the fluorescence responses of GACh2.0 expressing MEC stellate neurons to electrical stimulations consisting of a train of 20 pulses at higher frequency (1 Hz: 30.4 ± 3.1 s, Z = 0.169; p = 0.87; 2 Hz: 30.8 ± 2.0 s, Z = 0.338; p = 0.74; 4 Hz: 33.0 ± 2.1 s; Z = 0.338; p = 0.74; 8 Hz: 36.4 ± 6.1 s, Z = 1.363; p = 0.17; 16 Hz: 31.0 ± 2.4 s, Z = 0.169; p = 0.87; n = 7 neurons from 5 animals) compared to the lowest frequency tested (0.5 Hz: 30.8 ± 5.7 s). (i) Fluorescence responses of GACh2.0 expressing MEC stellate neuron to electrical stimulations consisting of a train of up to 80 pulses at 2 Hz. (j) Values for the maximal responses of GACh2.0 expressing MEC stellate neurons to electrical stimulations consisting of a train of up to 80 pulses at 2 Hz (2 pulses: 0.70 ± 0.15%, Z = 1.960; p = 0.05; 5 pulses: 1.53 ± 0.38%, Z = 2.521; p = 0.012; 10 pulses: 2.22 ± 0.56%, Z = 2.521; p = 0.012; 20 pulses: 3.29 ± 0.95%, Z = 2.521; p = 0.012; 40 pulses: 4.07 ± 1.22%, Z = 2.366; p = 0.017; 80 pulse: 3.65 ± 1.30%, Z = 2.366; p = 0.017; n = 8 neurons from 4 animals) compared to single pulses (1 pulse: 0.50 ± 0.09%). (k) Values for 10–90% rise time of the maximal responses of GACh2.0 expressing MEC stellate neurons to electrical stimulations consisting of a train of up to 80 pulses at 2 Hz (2 pulses: 1.8 ± 0.4 s, Z = 1.718; p = 0.08; 5 pulses: 2.0 ± 0.3 s, Z = 1.955; p = 0.05; 10 pulses: 3.3 ± 0.3 s, Z = 2.666; p = 0.008; 20 pulses: 5.0 ± 0.6 s, Z = 2.666; p = 0.008; 40 pulses: 6.5 ± 1.4 s, Z = 2.666; p = 0.008; n = 9 neurons from 6 animals) compared to single pulses (1 pulse: 1.3 ± 0.3 s), and decay time constant of the maximal responses of GACh2.0 expressing MEC stellate neurons to electrical stimulations consisting of a train of up to 80 pulses at 2 Hz (2 pulses: 32.2 ± 2.6 s, Z = −0.296; p = 0.77; 5 pulses: 33.9 ± 2.1 s, Z = 0.178; p = 0.86; 10 pulses: 32.8 ± 1.1 s, Z = −0.415; p = 0.68; 20 pulses: 32.7 ± 1.7 s, Z = −0.338; p = 0.75; 40 pulses: 31.8 ± 2.3 s, Z = −0.415; p = 0.68; n = 9 neurons from 6 animals) compared to single pulses (1 pulse: 32.9 ± 3.5 s). Note the stimulation pulse number-dependent increase in 10–90% rise time, but not in decay time constant. (l) A snapshot of another GACh2.0 expressing stellate cell. (m) Upper, snapshots of fluorescence responses of the GACh2.0 expressing neuron in (l) to a minimal L1 electrical stimulation. The fluorescence recording trace immediately below shows the average fluorescence response of the neuron. The lower fluorescence recording traces show ΔF/F0 responses in the subcellular regions of interest (ROIs) marked by color squares (~1.5 μm x ~1.5 μm) in (l). Note the largest ΔF/F0 responses seen in two red ROIs (#9 and #1) suggestive of possible activation of multiple cholinergic fibers and/or release sites, and the slower rising times of smaller responses in other ROIs expected for diffused ACh. (n) Upper, plot of ΔF/F0 responses in ROIs against the distance from the ROI with maximal ΔF/F0. The data points (n = 67 from 6 neurons of 6 animals) were arbitrarily fitted to a single exponential decay function (pink line), resulting in an estimated volume spread length constant of ~9 μm. Lower, plot of ΔF/F0 against F0 indicates no correlation between ΔF/F0 and F0 (n = 67; two-sides Normality test p = 0.06; two-sides Constant variance test p = 0.80; r = 0.107; p = 0.39; two-sides Linear regression t test). The relative ΔF/F0 responses, or the ΔF/F0 responses normalized to the largest ΔF/F0 responses in the same neurons, were used in analysis in (n). Data are shown with mean ± s.e.m, where large black dots indicate mean response, error bars indicate s.e.m. Experiments in (b),(d),(f), (i),(l),(m) were repeated independently for more than 6 animals with similar results. *, p < 0.05 (Wilcoxon tests, two-sides).
Figure 5
Figure 5. GACh sensors reveal dynamics of endogenous ACh release in Drosophila.
(a) Schematic illustration of the two-photon imaging setup of the Drosophila olfactory system. Odor was delivered near the antenna (Left) and GACh signals were measured in the antennal lobe area of GH146-Gal4: UAS-GACh flies (Right). (b) Pseudocolor images of GACh expressing antenna lobes show fluorescence responses to mineral oil and odor isoamyl acetate (IA). (c) Time courses of the IA-dependent responses in DM2 and DA1 glomeruli of GACh1.0 (upper plots) and GACh2.0 (lower plots) expressing antenna lobes. The traces were averaged from 3 trials in the same fly. (d) Values for the maximal ΔF/F0 in DM2 and DA1 glomeruli of GACh1.0 (upper plot; DM2: 0.29 ± 0.49%, n = 9 flies; DA1: −1.01 ± 0.68%, n = 9 flies, U = 55, p = 0.22 for mineral oil; DM2: 7.02 ± 0.56%, n = 9 flies; DA1: −0.61 ± 0.80%, n = 9 flies, U = 81, p = 4.12E-4 for 10–3 IA; DM2: 12.97 ± 1.28%, n = 7 flies; DA1: 0.17 ± 0.39%, n = 7 flies, U = 49, p = 0.002 for IA 10–2) and GACh2.0 (lower plot; DM2: 2.27 ± 2.34%, n = 8 flies; DA1: −0.73 ± 1.41%, n = 8 flies, U = 35, p = 0.80 for mineral oil, DM2: 18.78 ± 1.36%, n = 10 flies; DA1: −2.37 ± 1.06%, n = 10 flies, U = 100, p = 1.83E-4 for 10–3 IA; DM2: 37.30 ± 4.79%, n = 9 flies; DA1: −0.55 ± 2.68%, n = 9 flies, U = 81, p = 4.12E-4 for 10–2 IA) expressing antenna lobes. (e) Upper, IA-evoked responses in DM2 glomerulus of GACh1.0 and GACh2.0 transgenic flies. Lower: values for the maximal ΔF/F0 in DM2 glomerulus of GACh1.0 and GACh2.0 transgenic flies (GACh1.0: 12.97 ± 1.28%, n = 7 flies; GACh2.0: 37.30 ± 4.79% n = 9 flies; U = 63, p = 0.001). Data are shown with mean ± s.e.m, with error bars indicate s.e.m. Experiments in (b) were repeated independently for more than 7 flies with similar results. **, p < 0.01 (Mann-Whitney Rank Sum non-parametric tests, two-sides). All scale bars, 10 μm.
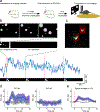
Figure 6
Figure 6. Attention-engaging visual stimuli evoke ACh release in behaving mice.
(a) Schematic drawing outlines the design of in vivo imaging experiments. (b) Upper, schematic representation of the visual stimulus applied to head-fixed behaving mice. The visual stimulus consists of 10 seconds of expanding white circles appearing at random locations on the screen, followed by 50 seconds of darkness. Lower, 4-minute fluorescence response traces corresponding to the four repetitions of single stimuli. (c) An imaged region (100 × 100 μm, 120 μm deep) contains two GACh2.0 expressing neurons with the red squares indicating regions of interest (ROIs). (d) Mean fluorescence responses from ROIs shown in (b). The fluorescence response traces were divided into 10 second segments with every minute containing one 10-s trace corresponding to the period of visual stimulus and five 10-s traces corresponding to periods of darkness. The signal from the middle three dark segments (black line) was compared to the signal from the visual stimulus segments (blue line; 15 trials per region). Shaded bands around the solid blue trace show the 95% confidence interval obtained by bootstrap. Note that ROI #1, but not ROI #2, shows an increase in fluorescence responses to the visual stimulus. (e) Average fluorescence responses obtained during the period of visual stimulation compared to those during the period of darkness (Visual: 3.37 ± 2.26%; Dark: 0.05 ± 0.83%; Z = −2.666, p = 0.008; n = 9 neurons from 8 animals). Note the same ACh signals observed after 1-day (n = 5 neurons from 4 animals), 2-day (n = 2 neurons from 2 animals), and 4−6-day (n = 2 neurons from 2 animals) in vivo Sindbis or rapid AAV viral expression, which suggest the suitability of GACh sensors for multiple-day imaging, and the analysis made from the pooled data. Data are shown with mean ± s.e.m, with shaded bands indicate s.e.m. Wilcoxon tests performed in (e), two-sides.

Similar articles

Cited by

References

    1. Ballinger EC, Ananth M, Talmage DA & Role LW Basal forebrain cholinergic circuits and signaling in cognition and cognitive decline. Neuron 91, 1199–1218 (2016). - PMC - PubMed
    1. Picciotto MR, Higley MJ & Mineur YS Acetylcholine as a neuromodulator: cholinergic signaling shapes nervous system function and behavior. Neuron 76, 116–129 (2012). - PMC - PubMed
    1. Dani JA & Bertrand D Nicotinic acetylcholine receptors and nicotinic cholinergic mechanisms of the central nervous system. Annual review of pharmacology and toxicology 47, 699–729 (2007). - PubMed
    1. Dineley KT, Pandya AA & Yakel JL Nicotinic ACh receptors as therapeutic targets in CNS disorders. Trends in pharmacological sciences 36, 96–108 (2015). - PMC - PubMed
    1. Kruse AC et al. Muscarinic acetylcholine receptors: novel opportunities for drug development. Nature reviews. Drug discovery 13, 549–560 (2014). - PMC - PubMed

Publication types