Aubergine and piRNAs promote germline stem cell self-renewal by repressing the proto-oncogene Cbl
- PMID: 29030484
- PMCID: PMC5666619
- DOI: 10.15252/embj.201797259
Aubergine and piRNAs promote germline stem cell self-renewal by repressing the proto-oncogene Cbl
Abstract
PIWI proteins play essential roles in germ cells and stem cell lineages. In Drosophila, Piwi is required in somatic niche cells and germline stem cells (GSCs) to support GSC self-renewal and differentiation. Whether and how other PIWI proteins are involved in GSC biology remains unknown. Here, we show that Aubergine (Aub), another PIWI protein, is intrinsically required in GSCs for their self-renewal and differentiation. Aub needs to be loaded with piRNAs to control GSC self-renewal and acts through direct mRNA regulation. We identify the Cbl proto-oncogene, a regulator of mammalian hematopoietic stem cells, as a novel GSC differentiation factor. Aub stimulates GSC self-renewal by repressing Cbl mRNA translation and does so in part through recruitment of the CCR4-NOT complex. This study reveals the role of piRNAs and PIWI proteins in controlling stem cell homeostasis via translational repression and highlights piRNAs as major post-transcriptional regulators in key developmental decisions.
Keywords: CCR4‐NOT deadenylation complex; PIWI proteins; germline stem cells; piRNAs; translational control.
© 2017 The Authors. Published under the terms of the CC BY 4.0 license.
Figures
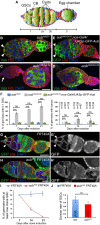
- A
Schematic diagram of a germarium showing the somatic cells (blue) and the germline cells (green). The spectrosomes and fusomes are shown in orange. The different regions of the germarium are indicated. Region 1: dividing cysts; region 2: selection of the oocyte; region 3: egg chamber with posteriorly localized oocyte. GSCs, germline stem cells; CB, cystoblast.
- B–E
Immunostaining of germaria from 7‐day‐old females with anti‐Vasa (green, B–D) or anti‐GFP (green, E), and anti‐Hts (red). DAPI (blue) was used to visualize DNA. (B) aub HN2/+ was used as a control. (C, D) Examples of aub HN2/QC42 germ cell loss and tumor, respectively. (E) Phenotypic rescue of aub HN2/QC42 with UASp‐GFP‐Aub expressed using nos‐Gal4. White arrowheads indicate GSCs; the white arrow indicates GSC loss.
- F
Quantification of mutant germaria with 0–1 GSC, or with GSC tumors shown in (B–E). The number of scored germaria (n) is indicated on the right graph. Error bars represent standard deviation. ***P‐value < 0.001, ns, non‐significant, using the χ2 test.
- G–H’
Germaria containing control (G, G’) or aub HN2 mutant (H, H’) clonal GSCs stained with anti‐GFP (green) and anti‐Hts (red), 14 days after clone induction. DAPI (blue) was used to stain DNA. Clonal cells are marked by the lack of GFP. Clonal GSCs and cysts are outlined with dashed line. White arrowheads show clonal GSCs in the control. aub mutant clonal GSCs have been lost (H, H’).
- I
Quantification of germaria containing at least one clonal GSC at 7, 14, and 21 days after clonal induction. 50 to 219 germaria were analyzed per condition. Error bars represent standard deviation.
- J
Division rate of wild‐type and aub HN2 clonal GSCs. The number of scored germaria (n) is indicated. Error bars represent standard deviation. ***P‐value < 0.001 using the two‐tailed Student's t‐test.

- A, A’
aub HN2 clonal GSCs do not express Aub protein. Immunostaining of mosaic germaria with anti‐GFP (green) and anti‐Aub (red) 7 days after clonal induction. DAPI (blue) was used to visualize DNA. The white and yellow arrowheads indicate the control aub HN2/+ and the aub HN2 clonal GSCs, respectively.
- B–C’
aub mutant GSCs do not die by apoptosis. Immunostaining of control aub HN2/+ (B, B’) and mutant aub HN2/QC42 (C, C’) germaria with anti‐cleaved Caspase3 (green) and anti‐Hts (red). DAPI (blue) was used to visualize DNA. GSCs are outlined.
- D
Quantification of germaria shown in (B–C’) with cleaved Caspase3‐positive GSCs in 7‐, 14‐ and 21‐day‐old females. The percentages are not statistically different using the χ2 test.
- E–F’
aub mutant GSCs do not express Bam. Immunostaining of control aub HN2/+ (E, E’) and mutant aub HN2/QC42 (F, F’) germaria with anti‐Bam (green) and anti‐Hts (red). DAPI (blue) was used to visualize DNA. GSCs are outlined.
- G
Quantification of mutant germaria with 0–1 GSC shown in Fig 2A and B, showing that the GSC loss remains high in chk2 aub double mutant. The genotypes are indicated at the top. The number of scored germaria (n) is indicated in Fig 2C.
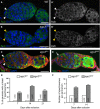
- A–B’
Immunostaining of wild‐type (A, A’) and ago3 t1/t3 mutant (B, B’) germaria with anti‐Aub (green) showing that Aub expression is not affected in ago3 mutant GSCs. DAPI (blue) was used to visualize DNA. White and yellow arrowheads indicate wild‐type and mutant GSCs, respectively.
- C, D
Immunostaining of control ago3 t2/+ (C) and ago3 t2/t3 mutant (D) germaria with anti‐Vasa (green) and anti‐Hts (red). DAPI (blue) was used to visualize DNA. White arrowheads indicate GSCs, and the white arrow indicates the increased number of cells with spectrosomes.
- E, F
Quantification of germaria shown in (C, D) with increased number of spectrosomes (E) and quantification of spectrosomes per germarium (F). The number of scored germaria (n) is indicated. ***P‐value < 0.001 using the χ2 test in (E) and the two‐tailed Student's t‐test in (F).
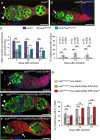
- A, B
Immunostaining of germaria with anti‐Vasa (green) and anti‐Hts (red). DAPI (blue) was used to visualize DNA. Examples of mnk P6 and mnk P6 aub HN2/QC42 germaria are shown. White arrowheads indicate GSCs; the white arrow indicates GSC loss.
- C
Quantification of the number of GSCs per non‐tumorous germarium, and of germaria with GSC tumors, in the indicated genotypes. The number of scored germaria (n) is indicated. Error bars represent standard deviation. The two‐tailed Student's t‐test and the χ2 test were used in the left and right panels, respectively. ***P‐value < 0.001, **P‐value < 0.01, *P‐value < 0.05.
- D–F
Immunostaining of germaria from 7‐day‐old females with anti‐Vasa or anti‐GFP (green) and anti‐Hts (red). DAPI (blue) was used to visualize DNA. aub HN2/QC42; nos‐Gal4/+ was used as a negative control. Examples of rescue in aub HN2/QC42; nos‐Gal4/UASp‐GFP‐Aub germarium (E), and of lack of rescue in aub HN2/QC42; nos‐Gal4/UASp‐GFP‐Aub AA germarium (F). White arrowheads indicate GSCs; white arrows indicate GSC loss in (D) and germ cell loss in (F).
- G
Quantification of mutant germaria with 0–1 GSC shown in (D–F). The number of scored germaria (n) is indicated. Error bars represent standard deviation. ***P‐value < 0.001, ns, non‐significant, using the χ2 test.

- A–B’
GFP‐Aub and GFP‐AubAA are expressed at similar levels in GSCs using the nos‐Gal4 driver. Immunostaining of nos‐Gal4/UASp‐GFP‐Aub (A, A’) and nos‐Gal4/UASp‐GFP‐Aub AA (B, B’) ovaries with anti‐GFP (green) and anti‐Hts (red). DAPI (blue) was used to visualize DNA. White arrowheads indicate GSCs.
- C
Quantification of GFP‐Aub and GFP‐AubAA protein levels in GSCs using fluorescence intensity of immunostaining with anti‐GFP shown in (A’, B’). Fluorescence intensity was measured in arbitrary units using the ImageJ software. Horizontal bars correspond to the mean and standard deviation. ns, non‐significant using the two‐tailed Student's t‐test. The number of cells analyzed is shown in the figure as dots or squares.
- D, E
GSC self‐renewal defect in armi mutant. Immunostaining of control armi 1/+ (D) and armi 1/72.1 mutant (E) germaria with anti‐Vasa (green) and anti‐Hts (red). DAPI (blue) was used to visualize DNA. White arrowheads indicate GSCs; the white arrow indicates reduced number of GSCs.
- F
Quantification of germaria with 0–1 GSC shown in (D, E), in 7‐, 14‐ and 21‐day‐old females. The number of scored germaria (n) is indicated. Error bars represent standard deviation. ***P‐value < 0.001 using the χ2 test.
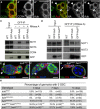
- A–B’’
Immunostaining of wild‐type (A–A’’) or nos‐Gal/UASp‐CCR4‐HA (B–B’’) germaria with anti‐Aub (red), and anti‐CCR4 or anti‐HA (green). GSCs are shown in (A–A’’). White arrowheads in (B–B’’) indicate cytoplasmic accumulation of CCR4‐HA colocalized with Aub in GSCs.
- C
Co‐immunoprecipitation (IP) of NOT1, NOT3, and CCR4 with GFP‐Aub in ovaries. Wild‐type (WT, mock IP) or nos‐Gal4/UASp‐GFP‐Aub (GFP‐Aub) ovarian extracts were immunoprecipitated with anti‐GFP, either in the absence or the presence of RNase A. Western blots were revealed with anti‐GFP, anti‐NOT1, anti‐NOT3, and anti‐CCR4. Inputs are extracts prior to IP.
- D
Co‐IP of NOT1 and NOT3 with GFP‐Aub or GFP‐AubAA in ovaries. Wild‐type (WT, mock IP), nos‐Gal4/UASp‐GFP‐Aub (GFP‐Aub), or nos‐Gal4/UASp‐GFP‐Aub AA (GFP‐AubAA) ovarian extracts were immunoprecipitated with anti‐GFP in the presence of RNase A. Western blots were revealed with anti‐GFP, anti‐NOT1, and anti‐NOT3. Inputs are extracts prior to IP.
- E–G
Genetic interaction between aub and twin in GSC self‐renewal. Immunostaining of germaria with anti‐Vasa (green) and anti‐Hts (red). DAPI (blue) was used to visualize DNA. Examples of aub HN2/+, twin DG24102 and aub HN2/+; twin DG24102 germaria are shown. White arrowheads indicate GSCs; the white arrow indicates GSC loss.
- H
Quantification of mutant germaria with no GSC in 3‐, 7‐, and 14‐day‐old females of the genotypes shown in (D–F). The number of scored germaria (n) is indicated. ***P‐value < 0.001 using the χ2 test.
- A
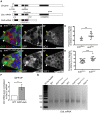
Genomic organization of the Cbl locus and Cbl mRNAs. Open boxes represent UTRs and introns, and black boxes are exons. The insertion points in the Cbl EY11427 and Cbl MB05683 mutants are represented by white triangles. The region encoding the E3 ubiquitin ligase domain (Ring finger) is indicated. The regions used to raise the 8C4 and 10F1 monoclonal antibodies are underlined.
- B–C’’
Immunostaining of mosaic germaria with anti‐GFP (green), to identify clonal cells by the lack of GFP, and either 8C4 (B–B’’) or 10F1 (C–C’’) monoclonal anti‐Cbl (red). DAPI was used to visualize DNA. White arrowheads indicate aub HN2/+ control GSCs; yellow arrowheads indicate clonal mutant aub HN2 GSCs. Scale bars: 10 μm.
- D, E
Quantification of Cbl protein levels in aub HN2/+ and aub HN2 mutant GSCs using fluorescence intensity of immunostaining with 8C4 or 10F1. Fluorescence intensity was measured in arbitrary units using the ImageJ software. Horizontal bars correspond to the mean and standard deviation. **P‐value < 0.01, ***P‐value < 0.001 using the two‐tailed Student's t‐test. The number of cells analyzed is indicated as the dots in the figure itself.
- F
RNA immunoprecipitation (IP) with anti‐GFP antibody in wild‐type (mock IP) and nos‐Gal4/UASp‐GFP‐Aub ovarian extracts. Cbl mRNA was quantified using RT–qPCR. Normalization was with RpL32 mRNA. Mean of three biological replicates. The error bar represents standard error to the mean. *P‐value < 0.05 using the two‐tailed Student's t‐test.
- G
ePAT assay of CblL mRNA. Ovaries from 1‐day‐old (germarium to stage 8) wild‐type, aub and twin mutant females, and from 4‐ to 7‐day‐old bam mutant females were used.
- A
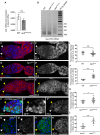
Quantification by RT–qPCR of CblL mRNA in dissected germaria/early egg chambers from wild‐type and aub HN2/QC42 females. Normalization was with RpL32 mRNA. Mean of three biological replicates. Error bars represent standard error to the mean. ns, non‐significant using the two‐tailed Student's t‐test.
- B
ePAT assay of mei‐P26 mRNA showing elongated poly(A) tail in twin mutant. Ovaries from 1‐day‐old (germarium to stage 8) wild‐type, aub and twin mutant females were used.
- C–E’
Immunostaining of wild‐type (C, C’), ago3 mutant (D, D’), and twin mutant (E, E’) germaria with anti‐Cbl 8C4 antibody (red). DAPI (blue) was used to visualize DNA. White and yellow arrowheads indicate wild‐type and mutant GSCs, respectively.
- F–F’’
Immunostaining of twin DG24102 mosaic germaria 7 days after clone induction, with anti‐GFP (green) and 8C4 anti‐Cbl antibody (red). DAPI (blue) was used to visualize DNA. White arrowheads indicate control (twin DG24102/+) GSCs; yellow arrowheads indicate twin DG24102 mutant GSCs.
- G–H’
Immunostaining of control armi 1/+ (G, G’) and armi 1/72.1 mutant (H, H’) germaria with anti‐Cbl 8C4 antibody (green). DAPI (blue) was used to visualize DNA. White and yellow arrowheads indicate wild‐type and mutant GSCs, respectively.
- I–L
Quantification of Cbl protein levels in GSCs using fluorescence intensity of immunostaining with 8C4 antibody. Fluorescence intensity was measured in arbitrary units using ImageJ. Horizontal bars correspond to the mean and standard deviation. ***P‐value < 0.001, *P‐value < 0.05, ns, non‐significant, using the two‐tailed Student's t‐test. The number of cells analyzed is shown in the figure as dots or squares (I, J).
- A
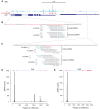
GFP‐Aub crosslinks in cultured GSCs (Ma et al, 2017), in Cbl mRNAs. Thin boxes are 5′‐ and 3′UTRs, lines are introns, and thick boxes are exons. The coverage of Cbl mRNAs with iCLIP reads is shown in blue. Significant crosslink clusters are shown in red.
- B, C
Sequences of crosslinked regions in 5′UTR (B) and 3′UTR (C) of CblL mRNA. The nucleotides (nt) in significant crosslink clusters are in red. The sequence, occurrence, and origin of anti‐sense piRNAs from ovarian and embryonic libraries are indicated. Mismatched nt are in blue.
- D, E
Coverage of CblL (D) and CblS (E) mRNAs with ovarian and embryonic piRNAs. Significant crosslink clusters are indicated in red at the top of the graphs.
- A–E
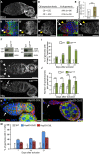
Cbl expression in germaria. (A) Immunostaining of wild‐type germaria with anti‐Cbl 8C4. (B–B’’) Immunostaining of bamP‐GFP germaria that express GFP under the bam promoter, with anti‐GFP (green) and anti‐Cbl 8C4 (red). (C–C’) Immunostaining of germaria expressing GFP‐Par1 to label spectrosomes with anti‐GFP (green) and anti‐Cbl 8C4 (red). DAPI (blue) was used to visualize DNA. White arrowheads indicate GSCs; yellow arrowheads indicate cystoblasts. (D) Quantification of germaria showing similar or increased Cbl protein levels in cystoblasts as compared to GSCs. (E) Quantification of increased Cbl protein levels in cystoblasts using fluorescence intensity of immunostaining with 8C4 antibody. Fluorescence intensity was measured in arbitrary units using ImageJ, in germaria showing increased Cbl levels in cystoblasts. The number of scored cells (n) is indicated. Intensity in GSCs was set to 1. The error bar represents standard deviation. ***P‐value < 0.001 using the two‐tailed Student's t‐test.
- F
Western blots of protein extracts from wild‐type and Cbl mutant ovaries showing CblL (left panel) and CblS (right panel) revealed with 8C4 and 10F1 antibodies, respectively. A low level of CblS remained, while no CblL was present in the Cbl EY11427/MB05683 combination. The 10F1 antibody recognizes very poorly CblL in western blot.
- G–J
Cbl is required for germline differentiation. Immunostaining of wild‐type and Cbl EY11427/MB05683 germaria with anti‐Hts to visualize spectrosomes and fusomes. White arrowheads indicate GSCs; the white arrow indicates increased number of spectrosomes. (I) Quantification of germaria with increased number of spectrosomes, and (J) quantification of spectrosomes per germarium. The number of scored germaria (n) is indicated in (I). Error bars represent standard deviation. ***P‐value < 0.001 using the χ2 test in (I), and the two‐tailed Student's t‐test in (J).
- K–M
Cbl induces GSC differentiation. Immunostaining of germaria overexpressing Cbl with Hsp83‐CblL (K) or Hsp83‐CblS (L) with anti‐Vasa (green) and anti‐Hts (red). DNA (blue) was revealed with DAPI. White arrows indicate a cyst in the GSC niche (K, outlined) or the loss of GSCs and germ cells (L). (M) Quantification of germaria with 0–1 GSC in the indicated genotypes. The number of scored germaria (n) is indicated. ***P‐value < 0.001 using the χ2 test.

- A, B
Immunostaining of germaria from aub HN2/QC42 (A) and aub HN2/QC42; Cbl MB/+ (B) females with anti‐Vasa (green) and anti‐Hts (red). DAPI (blue) was used to visualize DNA. The white arrow indicates the lack of GSCs; white arrowheads indicate GSCs. Scale bars: 10 μm.
- C
Quantification of mutant germaria with 0–1 GSC in the indicated genotypes. The number of scored germaria (n) is indicated. ***P‐value < 0.001, **P‐value < 0.01, *P‐value < 0.05, using the χ2 test.
- D
Model of Aub function in GSCs. Aub is required intrinsically in GSCs for their self‐renewal and differentiation. Aub function in self‐renewal depends on translational repression of Cbl mRNA in GSCs through the recruitment of the CCR4‐NOT complex. In cystoblasts, this translational repression is decreased, likely through the implication of at least another factor (X). As is the case for other translational controls in the GSC lineage, Aub/CCR4‐NOT acts in fine‐tuning Cbl levels. Aub function in GSC differentiation depends on activation of the Chk2 DNA damage checkpoint, consistent with a role in transposable element (TE) repression to maintain genome integrity; Ago3 has the same role in GSC differentiation.
Similar articles
-
Maternal mRNA deadenylation and decay by the piRNA pathway in the early Drosophila embryo.Nature. 2010 Oct 28;467(7319):1128-32. doi: 10.1038/nature09465. Epub 2010 Oct 17. Nature. 2010. PMID: 20953170 Free PMC article.
-
piRNAs and Aubergine cooperate with Wispy poly(A) polymerase to stabilize mRNAs in the germ plasm.Nat Commun. 2017 Nov 3;8(1):1305. doi: 10.1038/s41467-017-01431-5. Nat Commun. 2017. PMID: 29101389 Free PMC article.
-
Aubergine Controls Germline Stem Cell Self-Renewal and Progeny Differentiation via Distinct Mechanisms.Dev Cell. 2017 Apr 24;41(2):157-169.e5. doi: 10.1016/j.devcel.2017.03.023. Dev Cell. 2017. PMID: 28441530
-
PIWI, piRNAs, and germline stem cells: what's the link?Yale J Biol Med. 2009 Sep;82(3):121-4. Yale J Biol Med. 2009. PMID: 19774126 Free PMC article. Review. No abstract available.
-
piRNA pathway and the potential processing site, the nuage, in the Drosophila germline.Dev Growth Differ. 2012 Jan;54(1):66-77. doi: 10.1111/j.1440-169x.2011.01316.x. Dev Growth Differ. 2012. PMID: 23741748 Review.
Cited by
-
PIWI interacting RNAs perspectives: a new avenues in future cancer investigations.Bioengineered. 2021 Dec;12(2):10401-10419. doi: 10.1080/21655979.2021.1997078. Bioengineered. 2021. PMID: 34723746 Free PMC article. Review.
-
Coordinating Proliferation, Polarity, and Cell Fate in the Drosophila Female Germline.Front Cell Dev Biol. 2020 Feb 4;8:19. doi: 10.3389/fcell.2020.00019. eCollection 2020. Front Cell Dev Biol. 2020. PMID: 32117961 Free PMC article. Review.
-
RNA Helicase Vasa as a Multifunctional Conservative Regulator of Gametogenesis in Eukaryotes.Curr Issues Mol Biol. 2023 Jul 5;45(7):5677-5705. doi: 10.3390/cimb45070358. Curr Issues Mol Biol. 2023. PMID: 37504274 Free PMC article. Review.
-
The nucleolar transcriptome regulates Piwi shuttling between the nucleolus and the nucleoplasm.Chromosome Res. 2019 Mar;27(1-2):141-152. doi: 10.1007/s10577-018-9595-y. Epub 2018 Dec 12. Chromosome Res. 2019. PMID: 30539407
-
Environmentally-Induced Transgenerational Epigenetic Inheritance: Implication of PIWI Interacting RNAs.Cells. 2019 Sep 19;8(9):1108. doi: 10.3390/cells8091108. Cells. 2019. PMID: 31546882 Free PMC article. Review.
References
-
- Abdu U, Brodsky M, Schupbach T (2002) Activation of a meiotic checkpoint during Drosophila oogenesis regulates the translation of Gurken through Chk2/Mnk. Curr Biol 12: 1645–1651 - PubMed
MeSH terms
Substances
LinkOut - more resources
Full Text Sources
Other Literature Sources
Medical
Molecular Biology Databases
Research Materials
Miscellaneous

