IFN-γ-related mRNA profile predicts clinical response to PD-1 blockade
- PMID: 28650338
- PMCID: PMC5531419
- DOI: 10.1172/JCI91190
IFN-γ-related mRNA profile predicts clinical response to PD-1 blockade
Abstract
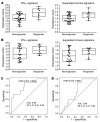
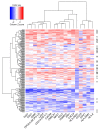
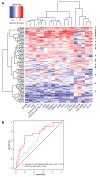
Programmed death-1-directed (PD-1-directed) immune checkpoint blockade results in durable antitumor activity in many advanced malignancies. Recent studies suggest that IFN-γ is a critical driver of programmed death ligand-1 (PD-L1) expression in cancer and host cells, and baseline intratumoral T cell infiltration may improve response likelihood to anti-PD-1 therapies, including pembrolizumab. However, whether quantifying T cell-inflamed microenvironment is a useful pan-tumor determinant of PD-1-directed therapy response has not been rigorously evaluated. Here, we analyzed gene expression profiles (GEPs) using RNA from baseline tumor samples of pembrolizumab-treated patients. We identified immune-related signatures correlating with clinical benefit using a learn-and-confirm paradigm based on data from different clinical studies of pembrolizumab, starting with a small pilot of 19 melanoma patients and eventually defining a pan-tumor T cell-inflamed GEP in 220 patients with 9 cancers. Predictive value was independently confirmed and compared with that of PD-L1 immunohistochemistry in 96 patients with head and neck squamous cell carcinoma. The T cell-inflamed GEP contained IFN-γ-responsive genes related to antigen presentation, chemokine expression, cytotoxic activity, and adaptive immune resistance, and these features were necessary, but not always sufficient, for clinical benefit. The T cell-inflamed GEP has been developed into a clinical-grade assay that is currently being evaluated in ongoing pembrolizumab trials.
Conflict of interest statement
Figures


Similar articles
-
Immune-Related Gene Expression Profiling After PD-1 Blockade in Non-Small Cell Lung Carcinoma, Head and Neck Squamous Cell Carcinoma, and Melanoma.Cancer Res. 2017 Jul 1;77(13):3540-3550. doi: 10.1158/0008-5472.CAN-16-3556. Epub 2017 May 9. Cancer Res. 2017. PMID: 28487385
-
Pembrolizumab for the treatment of PD-L1 positive advanced or metastatic non-small cell lung cancer.Expert Rev Anticancer Ther. 2016;16(1):13-20. doi: 10.1586/14737140.2016.1123626. Expert Rev Anticancer Ther. 2016. PMID: 26588948 Free PMC article. Review.
-
Differential Activity of Nivolumab, Pembrolizumab and MPDL3280A according to the Tumor Expression of Programmed Death-Ligand-1 (PD-L1): Sensitivity Analysis of Trials in Melanoma, Lung and Genitourinary Cancers.PLoS One. 2015 Jun 18;10(6):e0130142. doi: 10.1371/journal.pone.0130142. eCollection 2015. PLoS One. 2015. PMID: 26086854 Free PMC article.
-
Predictive biomarkers for programmed death-1/programmed death ligand immune checkpoint inhibitors in nonsmall cell lung cancer.Curr Opin Oncol. 2016 Mar;28(2):122-9. doi: 10.1097/CCO.0000000000000263. Curr Opin Oncol. 2016. PMID: 26756384 Review.
-
T-Cell-Inflamed Gene-Expression Profile, Programmed Death Ligand 1 Expression, and Tumor Mutational Burden Predict Efficacy in Patients Treated With Pembrolizumab Across 20 Cancers: KEYNOTE-028.J Clin Oncol. 2019 Feb 1;37(4):318-327. doi: 10.1200/JCO.2018.78.2276. Epub 2018 Dec 13. J Clin Oncol. 2019. PMID: 30557521 Clinical Trial.
Cited by
-
Systemic inflammation and pro-inflammatory cytokine profile predict response to checkpoint inhibitor treatment in NSCLC: a prospective study.Sci Rep. 2021 May 25;11(1):10919. doi: 10.1038/s41598-021-90397-y. Sci Rep. 2021. PMID: 34035415 Free PMC article.
-
Immunogenic cell death signatures from on-treatment tumor specimens predict immune checkpoint therapy response in metastatic melanoma.Sci Rep. 2024 Oct 2;14(1):22872. doi: 10.1038/s41598-024-74636-6. Sci Rep. 2024. PMID: 39358546 Free PMC article.
-
Neoadjuvant atezolizumab plus chemotherapy in gastric and gastroesophageal junction adenocarcinoma: the phase 2 PANDA trial.Nat Med. 2024 Feb;30(2):519-530. doi: 10.1038/s41591-023-02758-x. Epub 2024 Jan 8. Nat Med. 2024. PMID: 38191613 Free PMC article. Clinical Trial.
-
Exploring public cancer gene expression signatures across bulk, single-cell and spatial transcriptomics data with signifinder Bioconductor package.NAR Genom Bioinform. 2024 Oct 3;6(4):lqae138. doi: 10.1093/nargab/lqae138. eCollection 2024 Sep. NAR Genom Bioinform. 2024. PMID: 39363890 Free PMC article.
-
Cell-free DNA captures tumor heterogeneity and driver alterations in rapid autopsies with pre-treated metastatic cancer.Nat Commun. 2021 May 27;12(1):3199. doi: 10.1038/s41467-021-23394-4. Nat Commun. 2021. PMID: 34045463 Free PMC article.
References
Publication types
MeSH terms
Substances
LinkOut - more resources
Full Text Sources
Other Literature Sources
Medical
Research Materials

