. 2017 May 4;545(7652):54-59.
doi: 10.1038/nature22330. Epub 2017 Apr 26.

Assembly of functionally integrated human forebrain spheroids

Affiliations

Assembly of functionally integrated human forebrain spheroids

Fikri Birey et al. Nature. .

Abstract

The development of the nervous system involves a coordinated succession of events including the migration of GABAergic (γ-aminobutyric-acid-releasing) neurons from ventral to dorsal forebrain and their integration into cortical circuits. However, these interregional interactions have not yet been modelled with human cells. Here we generate three-dimensional spheroids from human pluripotent stem cells that resemble either the dorsal or ventral forebrain and contain cortical glutamatergic or GABAergic neurons. These subdomain-specific forebrain spheroids can be assembled in vitro to recapitulate the saltatory migration of interneurons observed in the fetal forebrain. Using this system, we find that in Timothy syndrome-a neurodevelopmental disorder that is caused by mutations in the CaV1.2 calcium channel-interneurons display abnormal migratory saltations. We also show that after migration, interneurons functionally integrate with glutamatergic neurons to form a microphysiological system. We anticipate that this approach will be useful for studying neural development and disease, and for deriving spheroids that resemble other brain regions to assemble circuits in vitro.


Conflict of interest statement

COMPETING FINANCIAL INTERESTS

H. C.F. and K.C.M. were employees of BD Genomics during this study.

Figures

Extended Data Figure 1
Extended Data Figure 1. Immunostaining of hSS in cryosections showing PV neurons
Two anti–PV antibodies have been used to validate specificity; co-localization with the neuronal marker DCX (day 209).
Extended Data Figure 2
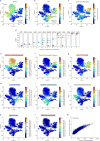
Extended Data Figure 2. Single cell gene expression of hCS and hSS at day 105 of differentiation (n= 11,838 cells; BD Resolve system)
(a) Distribution of expression of the neuronal marker STMN2, (b) the progenitor marker VIM and of (c) a set of genes associated with the M cell cycle phase (AURKB, TPX2, UBE2C, HMMR, TOP2A, CCNB1, NUSAP1, NUF2, CDC6, HIST1H4C, BIRC5, CKS2). (d) Boxplots for genes enriched in each t-SNE cluster shown in Fig. 1j. (e–l) Top 25 genes in each of the 8 clusters shown in Fig. 1j (proportion of molecules per cells). (m) Scatter plot showing the number of genes detected versus the number of useful reads.
Extended Data Figure 3
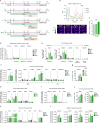
Extended Data Figure 3. Characterization of hSS differentiation conditions
(a) Schematic illustrating the differentiation conditions for deriving hCS or hSS: IS, ISA and and ISRA. (b) Representative traces of intracellular calcium measurements (Fluo-4) demonstrating spontaneous activity in hSS at ~day 50 of differentiation. (c) Average calcium spike frequency in 3 distinct hSS differentiation conditions: IS (n= 114 cells), ISA (n= 327 cells), ISRA (n= 136 cells); cells derived from 3 hiPSC lines; one-way ANOVA, F(3, 719)= 5.86, ***P< 0.001. (d) Gene expression (qPCR, normalized to GAPDH) showing down-regulation of OCT4 and the lack of mesoderm (BRACH) and endoderm (SOX17) markers following differentiation of hiPSC into hCS and hSS conditions. (e) Gene expression (qPCR, fold change versus hiPSC and normalized to GAPDH) showing upregulation of forebrain markers (SIX3, FOXG1) but not midbrain (LMX1B), hypothalamus (RAX1) or spinal cord (HOXB4) markers. (f) Expression of ventral forebrain genes in hSS and hCS (qPCR, normalized to GAPDH) at day 25. (g) Average percentage of the proportion of NKX2–1 by immunostaining in dissociated hCS or hSS at day 25. (h) Expression of ventral forebrain genes in hSS (qPCR, normalized to GAPDH) at day 60. (i) Expression of glutamatergic, GABAergic, dopaminergic and cholinergic neurotransmitter identify genes in hSS (qPCR, normalized to GAPDH) at day 60. (j) Average percentage of the proportion of MAP2/Hoechst and GAD67/MAP2 by immunostaining in dissociated hSS at day 60. (k, l) Expression of interneuron subtypes genes and markers associated with interneuron migration in hSS (qPCR, normalized to GAPDH) at day 60. Number of lines hiPSC used indicated on each column. Data are mean ± s.e.m.
Extended Data Figure 4
Extended Data Figure 4. Electrophysiological recordings of hCS and hSS
(a) Representative EPSC traces of recordings from hCS neurons (sliced preparation) before (black) and during (green) exposure to the glutamate receptor blocker kynurenic acid (1 mM) (Mann-Whitney U-test, **P= 0.007). (b) Overlap of averaged EPSCs (red) recorded in hCS neurons (n= 6 cells) and averaged IPSCs (black) recorded in hSS (n= 5 cells). Data are mean ± s.d.
Extended Data Figure 5
Extended Data Figure 5. Migration of Dlxi1/2::eGFP+ cells in fused hSS-hCS
(a, b) Representative immunostaining in cryosections of hSS showing co-expression of Dlxi1/2::eGFP and GAD67 and GABA. (c) Quantification by immunostaining of the proportion of Dlxi1/2::eGFP+ cells that co-express GAD67 in hSS derived using the ISA or ISRA condition (n= 3 hiPSC lines; t-test, P= 0.35). (d) Proportion of Dlxi1/2::eGFP and GAD67 positive cells in hSS derived using the ISA or ISRA condition that co-express SST (t-test, P= 0.48), CR (t-test, *P= 0.04) or CB (t-test, P= 0.43); n = 3 hiPSC lines. (e) Representative images of hSS-hCS at day 60 showing migration of Dlxi1/2b::eGFP+ cells (from fluorescently labeled hSS) in fused hSS-hCS but not in hSS-hSS over time. (f) The number of Dlxi1/2b::eGFP+ (hSS-derived) or hSYN1::mCherry cells (hCS-derived) that moved in hSS-hCS or hSS-hSS was quantified in snapshots of live, intact spheroids at different time points (from day 3 to 25). The values shown are absolute number of cells that migrated to the other side (approximately the same area and thickness was imaged in each session); one-way ANOVA for cells at 17 days after assembly; F(2, 32)= 8.24, P= 0.001. (g) Representative images of fused hSS-hCS at day 91 showing migration of Dlxi1/2b::eGFP+ cells (from fluorescently labeled hSS) into fused hSS-hCS. (h) Representative image of an hSS that was plated on a glass coverslip and cultured for ~7 days. (i) Percentage of Dlxi1/2::eGFP inside the coverslip-plated hSS, in the rim (0–200 μm) or beyond this region (> 200 μm). (j) Quantification of the number of saltations of Dlxi1/2b::eGFP+ cells (n= 32 cells) inside the one-week coverslip-plated hSS, in the rim and outside this region (one-way ANOVA, interaction F (2, 30)= 22.12, P< 0.001; Bonferroni post-hoc ***P< 0.0001). (k) Diagram showing the angle of movement of migrating Dlxi1/2b::eGFP+ cells at 8–9 days after assembly of hSS-hCS. The angle was calculated between the leading process of Dlxi1/2b::eGFP+ cells that have moved into hCS and the fusion interface (n= 92 cells from 5 hiPSC lines). (l) Histogram showing the distribution of the distance of migrated Dlxi1/2b::eGFP+ cells relative to the edge of hCS in hSS-hCS at 30–50 days after assembly. The distance was measured in fixed 18 μm cryosections (n= 73 cells from 2 hiPSC lines). (m, n, o) Representative examples of Dlxi1/2b::eGFP+ cells migrated in the hCS that moved within a VZ-like region. The VZ-like region contains GFAP-expressing cells, is surrounded by TBR1+ cells and the migrated cells show GABA expression. Supplementary Video 2 shows movement of Dlxi1/2b::eGFP+ cells that is reminiscent of the ventricular-directed migration described in rodents.
Extended Data Figure 6
Extended Data Figure 6. Single cell gene expression of Dlxi1/2b::eGFP+ cells in hSS and hCS (Smart-seq2)
(a) Scheme showing the isolation by dissociation and fluorescence-activated cell sorting (FACS) of Dlxi1/2b::eGFP+ cells from hSS or hCS for single cell transcriptional analysis. (b) Violin plots showing expression in Dlxi1/2b::eGFP+ cells of selected genes associated with cortical, striatal and olfactory interneurons in hSS (light green, n= 123 cells) or hCS (dark green; n= 106 cells) at 2 weeks after assembly of hSS-hCS. (c) Violin plots showing expression in Dlxi1/2b::eGFP+ cells (at 4 weeks after assembly of hSS-hCS) in clusters A, B, and C (likelihood ratio test; GAD1, CELF4: P> 0.05; PBX3: P< e−7 for A versus B & C; NNAT: P< e−16 for C versus A & B, P< e−16 for B versus A & C; MALAT1: P< e−9 for C versus A & B; SOX11: P< e−16 for B versus A & C, P< e−9 for A versus B & C; GRIP2: P< e−8 for B versus A & C). (d) Scatter plot showing the number of genes detected (≥ 10 reads cutoff) versus the number of reads (n= 410 cells from combined single cell RNA-seq experiments after 2 weeks or 4 weeks of assembly in hSS-hCS). (e) Graph illustrating biologically variable transcripts (red circles) and non-variable transcripts (black circles) along with the technical noise from the ERCC spike in RNAs (blue dots). Green line shows the technical noise fit.
Extended Data Figure 7
Extended Data Figure 7. Immunocytochemistry and pharmacology in fused hSS-hCS
(a, b, c, d) Representative images of immunostainings for SST, GAD67, GABA, CR, CB in Dlxi1/2b::eGFP+ cells after migration in fused hSS-hCS. (e) Scheme illustrating the pharmacological manipulation of Dlxi1/2b::eGFP+ cells that are migrating in hSS-hCS. (f, g, h, i) Quantification of Dlxi1/2b::eGFP+ cell migration before and after exposure to 100 nM of the CXCR4 antagonist AMD3100 (n= 8 cells from 2 hiPSC lines; paired t-tests, *P= 0.03 for number of saltations, **P= 0.006 for saltation length, **P= 0.006 for speed when mobile, *P= 0.02 for path directness). (j) Plot illustrating the trajectory of Dlxi1/2b::eGFP+ cells in fused hSS-hCS before and after exposure to AMD3100. Data are mean ± s.e.m.
Extended Data Figure 8
Extended Data Figure 8. Migration of Dlx2i1/2b::eGFP cells in mouse and human forebrain brain slices versus hSS-hCS
(a, b, c) Representative images of human fetal cortex at GW20 showing immunostaining with antibodies against GFAP, BCL11B (CTIP2) and GABA. (d) Representative image showing cell labeling with the Dlx2i1/2b::eGFP reporter in human forebrain at GW18 (6 days after lentivirus infection) (e, f) Representative immunostainings in cryosections of human tissue at GW18 showing co-localization of Dlx2i1/2b::eGFP with NKX2-1 and GABA. (g) Representative images showing cell labeling with the Dlx2i1/2b::eGFP reporter in hSS-hCS (9 days after assembly), in human forebrain (GW18) and in mouse slice cultures (E18). (h, i) Comparison of Dlx2i1/2b::eGFP+ cell size and quantification of the ratio of soma diameter to the length of the leading process in fused hSS-hCS (n= 25 cells from 4 hiPSC lines), human forebrain at GW18 (n= 19 cells; black) and GW20 (n= 15 cells; gray), hSS-derived cells cultured on E14 mouse forebrain slices (n= 14 cells), and E18 mouse forebrain slices (n= 30 cells from 2 litters) (one-way ANOVA, interaction F(3, 97)= 11.61, P= 0.001, Bonferroni post-hoc ***P< 0.001, **P< 0.05). (j, k, l) Comparison of the number of saltations (n= 56 cells from 2 hiPSC lines; one-way ANOVA, interaction F(2, 103)= 29.27, P= 0.001, Bonferroni post-hoc ***P< 0.001), saltation length (n= 44 cells from 3 hiPSC lines; one-way ANOVA, interaction F(2, 91)= 3.0, P= 0.50), speed when mobile (n= 38 cells from 3 hiPSC lines; one-way ANOVA, interaction F(2, 83)= 11.38, P= 0.001, Bonferroni post-hoc ***P< 0.001) for Dlx2i1/2b::eGFP+ in fused hSS-hCS, human fetal forebrain (GW18: n= 19 cells; GW20: n= 15 cells), and E18 mouse forebrain slices (n= 14 cells for saltation length and speed, n= 16 cells for number of saltations from 2 litters). Data are mean ± s.e.m.
Extended Data Figure 9
Extended Data Figure 9. Derivation of TS hSS, migration and electroporation
(a) Sequencing of PCR-amplified DNA showing the p.G406R mutation in exon 8a of CACNA1C in TS (subject: 8303). (b) Representative images of hiPSC colonies expressing pluripotency markers (OCT4, SSEA4) in one TS subject (c) Level of gene expression (RT-qPCR, normalized to GAPDH) for NKX2-1 showing no defects in ventral forebrain induction in TS (two-way ANOVA; interaction F(2,15)= 0.20, P= 0.81; TS versus Ctrl F(1,15)= 0.16, P= 0.68). (d–g) Representative immunostainings in cryosections of TS hSS (day 60) showing expression of NKX2-1, GABA, MAP2, GAD67, SST and CR. (h) Calcium imaging (Fura-2) in dissociated hCS derived from TS subjects and controls (Ctrl: n= 81 cells from 2 subjects; TS: n= 147 cells from 2 subjects). Quantification of residual intracellular calcium ([Ca2+]i) following 67 mM KCl depolarization of Ctrl and TS cells in hCS cells. Residual [Ca2+]i was calculated by dividing the plateau calcium (C–A) level by the peak calcium elevation (B−A); (t-test, ***P< 0.001). (i) Quantification of [Ca2+]i following depolarization of Ctrl and TS cells in hSS (t-test, ***P< 0.001). (j) Representative image of fused TS hSS-hCS showing Dlxi1/2b::eGFP expression and migration. (k, l) Quantification of the number of saltations and saltation length of Dlx2i1/2b::eGFP cells in fused hSS-hCS across multiple Ctrl and TS lines (related to Fig. 3d, e). (m) Quantification of the speed when mobile of Dlxi1/2b::eGFP cells in fused hSS-hCS (Ctrl: n= 21 cells from 3 hiPSC lines derived from 3 subjects; TS: n= 29 cells from 3 hiPSC lines derived from 3 subjects; TS-Ctrl hybrid: n= 12 cells from 3 hiPSC line shown combinations; one-way ANOVA with Dunnett’s multiple comparison test; ***P< 0.001). (n) Electroporation of cDNA encoding the TS– and WT– CaV1.2 channels into slices of mouse E14 ganglionic eminences (GE). (o) Representative example of time-lapse live imaging depicting the saltatory migration of GFP+ cells in slices electroporated with CAG::GFP and either the WT–or the TS– CACNA1C. (p, q) Quantification of the number of saltations (t-test; **P< 0.01) and saltation length (t-test; ***P< 0.001) of GFP+ cells in electroporated mouse forebrain slices (WT: n= 33 cells; TS: n= 23 cells; from 3 litters). (r) Scheme illustrating pharmacological manipulation of LTCC during live imaging of fused hSS-hCS. (s) Quantification of speed when mobile following exposure to the LTCC blocker nimodipine (5 μM) (paired t-test; Ctrl: n= 13 cells from 3 hiPSC lines derived from 3 subjects, ***P< 0.001; TS: n= 12 cells from 2 hiPSC lines derived from 2 subjects, **P< 0.005). (t) Quantification of saltation length following exposure to roscovitine (15 μM) (paired t-test; Ctrl: n= 7 cells from 2 hiPSC lines derived from 2 subject, **P< 0.005; TS: n= 12 cells from 2 hiPSC lines derived from 2 subjects; ***P< 0.001). (u) Quantification of speed when mobile following exposure to roscovitine (15 μM) (paired t-tests; Ctrl: n= 9 cells from 2 hiPSC lines derived from 2 subjects, ***P< 0.001; TS: n= 12 cells from 2 hiPSC lines derived from 2 subjects; P= 0.05). Data are mean ± s.e.m.
Extended Data Figure 10
Extended Data Figure 10. Characterization of Dlxi1/2b::eGFP+ cells after migration
(a) Representative images of 3D–reconstructed Dlxi1/2b::eGFP+ cell morphologies before and after migration from hSS into hCS. (b) Quantification of dendritic branching of Dlxi1/2b::eGFP+ cells in hSS (n= 58 cells) and in hCS (n= 55 cells) of fused hSS-hCS (two-way ANOVA; interaction F(2, 129)= 11.29, P< 0.001; Bonferroni post-hoc *P< 0.05, ***P< 0.001). (c) Representative examples of action potentials (slice recordings) in Dlxi1/2b::eGFP+ cells in unfused hSS, in hSS of fused hSS-hCS and in hCS after migration in fused hSS-hCS. (d) AT showing expression of the GABAergic synapse marker GPHN (green) colocalized with SYN1 (red) in hCS of fused hSS-hCS but not in unfused hCS; the glutamatergic marker PSD95 (cyan) colocalized with SYN1 is found in both fused and unfused hCS (equal volumes 1.2 μm deep). (e) AT of a Dlxi1/2b::eGFP+ synapse illustrating the colocalization with SYN1 (red), GPHN (cyan), and VGAT (white); 5 consecutive 70 nm sections (3 × 3 μm). (f) Representative examples of whole-cell voltage clamp recordings of IPSCs and EPSCs from Dlxi1/2b::eGFP+ cells in unfused hSS, in fused hCS-hSS, or after migration in hCS (g) Representative examples of whole-cell voltage clamp recordings of IPSCs and EPSCs in cells recorded from unfused hCS cells and fused hCS cells. (h) Electrical stimulation and patch clamp recording in fused hSS-hCS showing evoked EPSCs and IPSCs before (black) and after exposure to 10 μM gabazine (red). (i) Average peri-stimulus synaptic events (IPSCs and EPSCs) in Dlxi1/2::eGFP+ cells recorded in the hCS side of fused hSS-hCS before and after electrical stimulation (paired t-test, *P< 0.05). Data are mean ±  s.e.m.
Figure 1
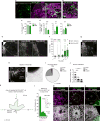
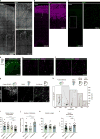
Figure 1. Characterization of hSS derived from hPSC
(a) Generation of hCS and hSS. (b) Fold changes (relative to gene expression in hPSC; normalized to GAPDH) of NKX2–1 (n= 6 hPSC lines; Mann-Whitney test, P= 0.002), FOXG1 (n= 5 hPSC lines; t-test, P= 0.35) and EMX1 (n= 4 hPSC lines; Mann-Whitney test, P= 0.02) in hCS and hSS at day 25. (c, d) Immunostaining of hSS for NKX2–1, (e, f) GABA, GAD67 and MAP2, and (g, h) SST, CR, CB, PV. (i, j) Single cell profiling of hCS and hSS. (k) AT volume in hSS for MAP2, GFAP, SYN1 and VGAT. (l) Patch clamping in sliced hSS and a representative trace of whole-cell current-clamp recording. (m, n) Spontaneous IPSCs before (black) and during (blue) application of gabazine in an hSS slice (paired t-test, **P= 0.004).
Figure 2
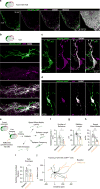
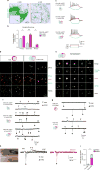
Figure 2. Cell migration in fused hSS-hCS
(a) Assembly of hCS and hSS. (b) Morphology before and after assembly. (c) Time-lapse of migration from hSS into hCS. (d) Assembly of hCS (AAV-hSYN1::mCherry) and hSS (Lenti-Dlxi1/2b::eGFP). (e) iDISCO-cleared hSS-hCS. (f, g) Saltatory migration of Dlxi1/2b::eGFP+ cells in fused hSS-hCS and (h) nucleokinesis. (I, j) Saltatory migration of Dlxi1/2b::eGFP+ cells in human fetal forebrain and (k) nucleokinesis.
Figure 3
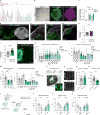
Figure 3. Modeling of interneuron migration in hSS-hCS derived from Timothy syndrome
(a) TS mutation in Cav1.2. (b) Calcium imaging in dissociated hSS (Ctrl: n= 38 cells from 2 subjects; TS: n= 68 cells from 2 subjects). (c) Migration of Dlxi1/2b::eGFP+ cells in TS and control hSS-hCS. (d, e) Number of saltations (Ctrl: n= 48 cells from 3 hiPSC lines derived from 3 subjects; TS: n= 51 cells from 3 hiPSC lines derived from 3 subjects; TS-Ctrl hybrid: n= 24 cells from 5 hiPSC line combinations from 2 TS and 2 Ctrl subjects), and saltation length (Ctrl: n= 21 cells from 3 hiPSC lines derived from 3 subjects; TS: n= 29 cells from 3 hiPSC derived from 3 subjects; TS-Ctrl hybrid: n= 12 cells from 3 hiPSC line combinations from 2 TS and 3 Ctrl subjects); one-way ANOVA with Dunnett’s multiple comparison test (***, P< 0.001). (f) Migration of TS and control Dlxi1/2b::eGFP+ cells in fused hSS-hCS (two-way ANOVA, interaction F(24, 408)= 17.71, P< 0.0001). (g) Saltation length following exposure to nimodipine (paired t-test; Ctrl: n= 13 cells from 3 hiPSC lines derived from 3 subjects, ***P< 0.001; TS: n= 12 cells from 2 hiPSC lines derived from 2 subjects, ***P< 0.001).
Figure 4
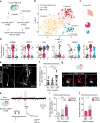
Figure 4. Functional integration of interneurons in fused hSS-hCS
(a) Isolation of Dlxi1/2b::eGFP+ cells for transcriptional analysis. (b) t-SNE visualization of single cell gene expression at day 121 (4 weeks after hSS-hCS assembly). (c) Distribution across clusters (χ2-test, χ2= 43.39, P< 0.0001). (d) Expression of ERBB4, NXPH1, IGF1, TCF4, FOS, RAD1. (e) Morphology of Dlxi1/2b::eGFP+ cells before and after migration into hCS (f) Action potential generation in Dlxi1/2b::eGFP+ cells (one-way ANOVA, F(2, 30)= 1.25; ***P< 0.001; Bonferroni post-hoc, **P< 0.01; ***P< 0.001). (g) GABAergic synapse (by AT) on the pallial side of hCS-hSS with SYN1, GPHN and VGAT. (h) EPSCs and IPSCs in Dlxi1/2b::eGFP+ cells after migration. (i) Synaptic responses in Dlxi1/2b::eGFP+ cells (two-way ANOVA, interaction F(2, 61)= 18.46, P< 0.0001; Bonferroni post-hoc for EPSCs, ***P< 0.0001, **P< 0.001). (j) Synaptic responses in excitatory cells (two-way ANOVA, cortical neurons in hCS before and after assembly F(1, 26)= 5.6, P< 0.05; Bonferroni post-hoc for IPSC, *P< 0.05).

Comment in

Similar articles

Cited by

References

    1. Kepecs A, Fishell G. Interneuron cell types are fit to function. Nature. 2014;505:318–326. doi: 10.1038/nature12983. - DOI - PMC - PubMed
    1. Wonders CP, Anderson SA. The origin and specification of cortical interneurons. Nat Rev Neurosci. 2006;7:687–696. doi: 10.1038/nrn1954. - DOI - PubMed
    1. Silbereis JC, Pochareddy S, Zhu Y, Li M, Sestan N. The Cellular and Molecular Landscapes of the Developing Human Central Nervous System. Neuron. 2016;89:248–268. doi: 10.1016/j.neuron.2015.12.008. - DOI - PMC - PubMed
    1. Bartolini G, Ciceri G, Marin O. Integration of GABAergic interneurons into cortical cell assemblies: lessons from embryos and adults. Neuron. 2013;79:849–864. doi: 10.1016/j.neuron.2013.08.014. - DOI - PubMed
    1. Rubenstein JL, Merzenich MM. Model of autism: increased ratio of excitation/inhibition in key neural systems. Genes Brain Behav. 2003;2:255–267. - PMC - PubMed

Publication types

MeSH terms

Supplementary concepts