. 2016 Nov 29;113(48):E7769-E7777.
doi: 10.1073/pnas.1607836113. Epub 2016 Nov 11.

Association of PD-1/PD-L axis expression with cytolytic activity, mutational load, and prognosis in melanoma and other solid tumors

Affiliations

Association of PD-1/PD-L axis expression with cytolytic activity, mutational load, and prognosis in melanoma and other solid tumors

Ludmila Danilova et al. Proc Natl Acad Sci U S A. .

Abstract

Programmed cell death protein-1 (PD-1)/programmed death ligand-1 (PD-L1) checkpoint blockade has led to remarkable and durable objective responses in a number of different tumor types. A better understanding of factors associated with the PD-1/PD-L axis expression is desirable, as it informs their potential role as prognostic and predictive biomarkers and may suggest rational treatment combinations. In the current study, we analyzed PD-L1, PD-L2, PD-1, and cytolytic activity (CYT) expression, as well as mutational density from melanoma and eight other solid tumor types using The Cancer Genome Atlas database. We found that in some tumor types, PD-L2 expression is more closely linked to Th1/IFNG expression and PD-1 and CD8 signaling than PD-L1 In contrast, mutational load was not correlated with a Th1/IFNG gene signature in any tumor type. PD-L1, PD-L2, PD-1, CYT expression, and mutational density are all positive prognostic features in melanoma, and conditional inference modeling revealed PD-1/CYT expression (i.e., an inflamed tumor microenvironment) as the most impactful feature, followed by mutational density. This study elucidates the highly interdependent nature of these parameters, and also indicates that future biomarkers for anti-PD-1/PD-L1 will benefit from tumor-type-specific, integrated, mRNA, protein, and genomic approaches.

Keywords: PD-1; PD-L1; PD-L2; melanoma; mutational load.


Conflict of interest statement

R.A.A. is a compensated consultant for Adaptive Biotech. D.M.P. has received research grants from Bristol-Myers Squibb and Potenza Therapeutics; consults for Amgen, Five Prime Therapeutics, GlaxoSmithKline, Jounce Therapeutics, MedImmune, Merck, Pfizer, Potenza Therapeutics, and Sanofi; owns stock options in Jounce and Potenza; and receives patent royalties through his institution, from Bristol-Myers Squibb, and Potenza. C.G.D. is a self-compensated consultant for Bristol-Myers Squibb, AstraZeneca/Medimmune, Roche/Genentech, Potenza Therapeutics, and Tizona Therapeutics; and has patents licensed by Bristol-Myers Squibb, AstraZeneca/Medimmune, and Potenza Therapeutics. J.M.T. is a compensated consultant for Bristol-Myers Squibb, AstraZeneca/Medimmune, and Merck.

Figures

Fig. S1.
Fig. S1.
PD-L, PD-1, and CYT expression levels are not dependent on whether the SKCM is a primary lesion vs. a metastasis or the location of the metastasis. Mutational load also does not differ by location of the metastasis. The mutational loads for primary melanomas were not available in the studied dataset.
Fig. S2.
Fig. S2.
Innate mechanisms of PD-L/PD-1 expression vary by tumor type, but do not influence levels of gene expression or survival outcome. (A) Amplifications and deletions are the most common genetic alterations in PD-L1 and -L2, whereas deletions and mutations are more common for PD-1. Across the PD-L/PD-1 axis, BLCA shows the highest percentage of genetic alterations, with 6–8% of cases demonstrating changes in each molecule. Approximately 4% of melanomas show PD-L alterations, with the largest proportion in both molecules being attributable to gene amplifications, and an only slightly lesser proportion harboring deletions. KIRC, BRCA, and PAAD demonstrate the lowest prevalence of alterations on the PD-1 axis, with <1% of KIRC harboring alterations, all of which are amplifications. (B) In 278 primary and metastatic melanomas studied, 3.6%, 4.0%, and 4.0% of cases show genetic alterations in PD-L1, -L2, and PD-1, respectively. PD-L1 and -L2 amplifications occur in tandem, which is in keeping with their proximity at the 9p24.1 locus, and point mutations are random. (C) PD-L expression does trend toward a relationship with copy number; however, the mean expression levels between groups are not statistically significant. Note that expression of PD-Ls is evident even in the cases with a deleted locus, which is indicative of the presence of PD-L–expressing immune cells. It is likely that such expression by immune cells mutes the potential impact of copy number changes. (D) Patients with copy number alterations in the PD-Ls also did not demonstrate different survival outcomes (data shown here for patients with SKCM). (E) PD-molecule expression is plotted by genetic subtype of SKCM (86), and shows no difference in expression levels between the groups (BRAF and RAS categories include hotspot mutants; NF1 includes any mutants). (F and G) Neither copy number changes or mutations in PTEN, respectively, result in significantly different PD-L1 or -L2 mRNA expression compared with wild-type. One case with a missense mutation in PTEN demonstrated relatively high levels of PD-L1 and -L2, but also had comparably high CYT expression. (H) We also considered that PTEN alteration could influence PD-L expression at a posttranscriptional level (36). To investigate this point, we identified n = 10 SKCM cases with high levels (>50%) of tumor-cell surface PD-L1 expression as observed at the protein level (6). We did not observe any correlation between high PD-L1 expression and PTEN loss. (Original magnification: 400×, all fields.)
Fig. S2.
Fig. S2.
Innate mechanisms of PD-L/PD-1 expression vary by tumor type, but do not influence levels of gene expression or survival outcome. (A) Amplifications and deletions are the most common genetic alterations in PD-L1 and -L2, whereas deletions and mutations are more common for PD-1. Across the PD-L/PD-1 axis, BLCA shows the highest percentage of genetic alterations, with 6–8% of cases demonstrating changes in each molecule. Approximately 4% of melanomas show PD-L alterations, with the largest proportion in both molecules being attributable to gene amplifications, and an only slightly lesser proportion harboring deletions. KIRC, BRCA, and PAAD demonstrate the lowest prevalence of alterations on the PD-1 axis, with <1% of KIRC harboring alterations, all of which are amplifications. (B) In 278 primary and metastatic melanomas studied, 3.6%, 4.0%, and 4.0% of cases show genetic alterations in PD-L1, -L2, and PD-1, respectively. PD-L1 and -L2 amplifications occur in tandem, which is in keeping with their proximity at the 9p24.1 locus, and point mutations are random. (C) PD-L expression does trend toward a relationship with copy number; however, the mean expression levels between groups are not statistically significant. Note that expression of PD-Ls is evident even in the cases with a deleted locus, which is indicative of the presence of PD-L–expressing immune cells. It is likely that such expression by immune cells mutes the potential impact of copy number changes. (D) Patients with copy number alterations in the PD-Ls also did not demonstrate different survival outcomes (data shown here for patients with SKCM). (E) PD-molecule expression is plotted by genetic subtype of SKCM (86), and shows no difference in expression levels between the groups (BRAF and RAS categories include hotspot mutants; NF1 includes any mutants). (F and G) Neither copy number changes or mutations in PTEN, respectively, result in significantly different PD-L1 or -L2 mRNA expression compared with wild-type. One case with a missense mutation in PTEN demonstrated relatively high levels of PD-L1 and -L2, but also had comparably high CYT expression. (H) We also considered that PTEN alteration could influence PD-L expression at a posttranscriptional level (36). To investigate this point, we identified n = 10 SKCM cases with high levels (>50%) of tumor-cell surface PD-L1 expression as observed at the protein level (6). We did not observe any correlation between high PD-L1 expression and PTEN loss. (Original magnification: 400×, all fields.)
Fig. 1.
Fig. 1.
Relative relationships between PD-L1 and -L2 expression levels, as well as relative relationships between PD-L1, CYT, and mutational load across multiple solid tumor types from ∼3,500 patients. (A) Median expression levels of PD-L2 and PD-L1 differ in some tumor types, with KIRC, SKCM, lung, pancreatic, and breast adenocarcinomas demonstrating the largest statistical difference in levels of expression between the two markers (*P < 0.05, **P < 0.001). Overall, each marker demonstrates greater variation of expression within a single tumor type than across tumor types. CYT and PD-1 expression levels and mutational load by tumor type are shown in Fig. S3 A and B, respectively. (B) Three-dimensional plot demonstrating the relative relationships between median PD-L1, CYT expression, and mutational load across tumor types. Three-dimensional plots demonstrating the relative relationships between PD-L2 and PD-1, CYT expression, and mutational load across tumor types are shown in Fig. S3 C and D.
Fig. S3.
Fig. S3.
Relative relationships between PD-molecules and CYT expression levels as well as mutational load across different cancer types from ∼3,500 patients. (A) PD-1 and CYT expression levels vary by tumor type, with CYT consistently expressed at higher levels than PD-1. As with expression of the PD-Ls (shown in Fig. 1), both markers demonstrate greater variation of expression within a single tumor type than across tumor types. (B) A similar trend in the differences in the median values of mutational load by tumor type, as well as the wide variance within a single tumor type, has been previously reported (40). Three-dimensional plot demonstrating the relative relationship between median (C) PD-L2 or (D) PD-1 and CYT expression levels with mutational load across multiple solid tumor types.
Fig. 2.
Fig. 2.
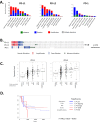
Strong correlations are observed between all PD-axis molecules and the presence of a host immune response, but not mutational load. (A) Heat maps of correlation coefficients between PD-molecules and mutational density and a Th1/IFNG gene signature. When viewed from a pan-cancer perspective, PD-L2 is more strongly associated with an antitumor host immune response than PD-L1. Perhaps most notably, mutational load is not associated with a Th1/IFNG gene signature in any tumor type studied. (B) Every other gene in the TCGA dataset was then studied to expand the analysis of factors that correlated and anticorrelated with PD-L1 and -L2. Cut-offs of 0.6 and −0.6 were used for the correlation coefficients for factors that correlated and anticorrelated with PD-L1, and pathway analysis was performed on these factors. PD-L1 and -L2 expression and the strength of their associations with IFNG, CD8 TCR, and PD-1 signaling vary by tumor type, with a notable lack of an association between PD-L1 expression and IFNG and CD8 TCR signaling in KIRC and LUSC. PD-L2 expression is more closely associated with the PD-1 signaling pathway in many of the tumor types studied. Additional pathways of interest are highlighted in Table S1. NA means a significant number of pathway genes did not have a correlation coefficient >0.6 or <−0.6.
Fig. S4.
Fig. S4.
B7-H3 and -H4 expression are not associated with an ongoing host immune response against tumor and show distinct effects on survival. (A) Heat maps showing the relationship between B7-H3 and B7-H4 expression and a Th1/IFN-γ gene signature (Dataset S1) by tumor type. Unlike PD-L1 and PD-L2, B7-H3 and -H4 do not show a correlation, save for a weak correlation in microsatellite stable COAD, and in fact appear to be weakly anticorrelated in some tumor types, such as SKCM. (B) Forest plots showing impact on HRs for expression of B7-H3 and -H4 as continuous variables by tumor type. B7-H3 (CD276) expression trends toward an adverse impact on survival in most tumor types studied, whereas the potential impact of B7-H4 (VTCN1) expression on survival is less apparent.
Fig. 3.
Fig. 3.
The impact of PD-L1, -L2, PD-1, CYT, and mutational load on survival varies by tumor type. (A) Forest plots showing the impact of PD-molecule and CYT expression on HRs from univariate Cox regression. The strongest associations were seen in SKCM, where all factors studied contributed to an improved prognosis. (B) Mutational load is a positive prognostic feature in SKCM and BLCA. *The number of samples varies between the mRNA expression-based assays and the DNA-based (mutation) analysis. **There was no difference in survival between HPV(+) and HPV(−) variants of HNSCC.
Fig. 4.
Fig. 4.
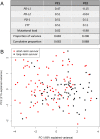
PCA for PD-1, PD-Ls, CYT expression, and mutational load in SKCM. (A) PD-1, PD-L1, PD-L2, and CYT expression all contribute nearly equally to the first principle component (PC1). Mutational load almost solely defines the second component (PC2). (B) When the annotation for short- vs. long-term SKCM survivors is superimposed on the PCA plot, a degree of separation is evident between the two populations along the PC1 axis. The percentage of the total variance captured by each axis is shown in parenthesis.
Fig. S5.
Fig. S5.
Hive plots demonstrating interrelationship between PD-L1, PD-L2, or PD-1, CYT, and mutational load and survival in SKCM. Each line represents an individual SKCM patient in the TCGA cohort, and the axes for expression of factors of interest or mutational load increase in value from the center of the plot. The cohort was split at the median for survival, with short-term survivors shown in red and long-term survivors shown in black. The circles are generally concentric, with long-term survivors demonstrating higher levels of CYT, mutational load, and (A) PD-L1, (B) PD-L2, or (C) PD-1 expression and short-term survivors demonstrating lower levels of each of these factors. PD-axis molecule expression levels and CYT track each other closely, whereas mutational density tends to be less aligned. (D) Exceptional patients are highlighted in yellow on this hive plot displaying the interrelationship between PD-L1, mutational load, and CYT. There is a patient (accession no. TCGA-EE-A29E, highlighted here by solid yellow line) with very high mutational load, low CYT, and low PD-L1 expression. Despite the high mutational burden, none were currently being recognized by the immune system at the time of specimen acquisition. On the opposite end of the spectrum is another patient (accession no. TCGA-D3-A2JB, also highlighted by solid yellow line), who shows one of the lowest mutational burdens in the cohort. However, the mutations that were seemingly immunogenic were actively being recognized by the immune system at the time of specimen acquisition, as the patient had a relatively high CYT infiltrate and level of PD-L1 expression.
Fig. 5.
Fig. 5.
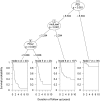
Conditional inference tree analysis demonstrating the relative contribution of CYT, PD-axis molecules, and mutational load to survival in SKCM patients. When the five studied factors are all entered into a multivariate model, PD-1 expression is the dominant factor influencing patient outcome. In patients demonstrating the highest levels of PD-1, it is the only significantly contributing factor out of those studied. For patients with PD-1 levels below this threshold, mutational load is the second most important factor influencing survival. In the ∼25% of cases with relatively low PD-1 expression and mutational load, PD-L2 expression also influences outcome. A four-factor model, including PD-L1, PD-L2, CYT, and mutational load, is shown in Fig. S6A.
Fig. S6.
Fig. S6.
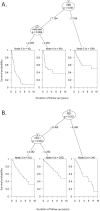
Conditional inference tree analyses prioritizing the contribution of the studied factors to survival. (A) A four-factor model studying the contribution of PD-L1, PD-L2, CYT, and mutational load to survival in SKCM patients reveals that CYT expression is the dominant factor influencing patient outcome. For the 45% of patients demonstrating the highest levels, it is the only significantly contributing factor. For patients with CYT levels below this threshold, mutational load emerges as the second most important factor. In this model, neither PD-L1 nor -L2 expression are independent contributors to patient survival. (B) A five-factor model (PD-1, PD-L1, PD-L2, CYT, and mutational load) for KIRC revealed that a combination of PD-1 and PD-L1 expression significantly contributed to survival in this tumor type, with high PD-1 expression serving as the dominant prognostic feature. PD-L1 expression is the second most important factor. These two factors show opposite effects, with increasing PD-1 expression serving as an adverse prognostic feature, and increasing PD-L1 expression associating with an improved prognosis.

Similar articles

Cited by

References

    1. Hanahan D, Weinberg RA. Hallmarks of cancer: The next generation. Cell. 2011;144(5):646–674. - PubMed
    1. Lennerz V, et al. The response of autologous T cells to a human melanoma is dominated by mutated neoantigens. Proc Natl Acad Sci USA. 2005;102(44):16013–16018. - PMC - PubMed
    1. Matsushita H, et al. Cancer exome analysis reveals a T-cell-dependent mechanism of cancer immunoediting. Nature. 2012;482(7385):400–404. - PMC - PubMed
    1. Robbins PF, et al. Mining exomic sequencing data to identify mutated antigens recognized by adoptively transferred tumor-reactive T cells. Nat Med. 2013;19(6):747–752. - PMC - PubMed
    1. Rooney MS, Shukla SA, Wu CJ, Getz G, Hacohen N. Molecular and genetic properties of tumors associated with local immune cytolytic activity. Cell. 2015;160(1-2):48–61. - PMC - PubMed

Publication types

MeSH terms

Substances