Density of immunogenic antigens does not explain the presence or absence of the T-cell-inflamed tumor microenvironment in melanoma
- PMID: 27837020
- PMCID: PMC5137753
- DOI: 10.1073/pnas.1609376113
Density of immunogenic antigens does not explain the presence or absence of the T-cell-inflamed tumor microenvironment in melanoma
Abstract
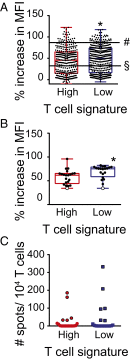
Melanoma metastases can be categorized by gene expression for the presence of a T-cell-inflamed tumor microenvironment, which correlates with clinical efficacy of immunotherapies. T cells frequently recognize mutational antigens corresponding to nonsynonymous somatic mutations (NSSMs), and in some cases shared differentiation or cancer-testis antigens. Therapies are being pursued to trigger immune infiltration into non-T-cell-inflamed tumors in the hope of rendering them immunotherapy responsive. However, whether those tumors express antigens capable of T-cell recognition has not been explored. To address this question, 266 melanomas from The Cancer Genome Atlas (TCGA) were categorized by the presence or absence of a T-cell-inflamed gene signature. These two subsets were interrogated for cancer-testis, differentiation, and somatic mutational antigens. No statistically significant differences were observed, including density of NSSMs. Focusing on hypothetical HLA-A2+ binding scores, 707 peptides were synthesized, corresponding to all identified candidate neoepitopes. No differences were observed in measured HLA-A2 binding between inflamed and noninflamed cohorts. Twenty peptides were randomly selected from each cohort to evaluate priming and recognition by human CD8+ T cells in vitro with 25% of peptides confirmed to be immunogenic in both. A similar gene expression profile applied to all solid tumors of TCGA revealed no association between T-cell signature and NSSMs. Our results indicate that lack of spontaneous immune infiltration in solid tumors is unlikely due to lack of antigens. Strategies that improve T-cell infiltration into tumors may therefore be able to facilitate clinical response to immunotherapy once antigens become recognized.
Keywords: T-cell inflammation; checkpoint blockade; immunotherapy; neoantigens; tumor microenvironment.
Conflict of interest statement
The authors declare no conflict of interest.
Figures


Similar articles
-
Melanocortin 1 Receptor-derived peptides are efficiently recognized by cytotoxic T lymphocytes from melanoma patients.Immunobiology. 2014 Mar;219(3):189-97. doi: 10.1016/j.imbio.2013.10.002. Epub 2013 Oct 12. Immunobiology. 2014. PMID: 24192537
-
Probing T-cell Infiltration in Tumors.Cancer Discov. 2017 Jan;7(1):5-6. doi: 10.1158/2159-8290.CD-NB2016-154. Epub 2016 Dec 7. Cancer Discov. 2017. PMID: 27927681
-
HLA class I loss in metachronous metastases prevents continuous T cell recognition of mutated neoantigens in a human melanoma model.Oncotarget. 2017 Apr 25;8(17):28312-28327. doi: 10.18632/oncotarget.16048. Oncotarget. 2017. PMID: 28423700 Free PMC article.
-
Immunologic recognition of malignant melanoma by autologous T lymphocytes.Curr Opin Oncol. 1993 Mar;5(2):383-9. doi: 10.1097/00001622-199303000-00018. Curr Opin Oncol. 1993. PMID: 8457622 Review.
-
Cancer Immunotherapy Targets Based on Understanding the T Cell-Inflamed Versus Non-T Cell-Inflamed Tumor Microenvironment.Adv Exp Med Biol. 2017;1036:19-31. doi: 10.1007/978-3-319-67577-0_2. Adv Exp Med Biol. 2017. PMID: 29275462 Free PMC article. Review.
Cited by
-
Tumor battlefield within inflamed, excluded or desert immune phenotypes: the mechanisms and strategies.Exp Hematol Oncol. 2024 Aug 6;13(1):80. doi: 10.1186/s40164-024-00543-1. Exp Hematol Oncol. 2024. PMID: 39107856 Free PMC article. Review.
-
Microenvironmental regulation of tumour immunity and response to immunotherapy.J Pathol. 2021 Jul;254(4):374-383. doi: 10.1002/path.5681. Epub 2021 May 19. J Pathol. 2021. PMID: 33846997 Free PMC article. Review.
-
Germinal center reactions in tertiary lymphoid structures associate with neoantigen burden, humoral immunity and long-term survivorship in pancreatic cancer.Oncoimmunology. 2021 Mar 17;10(1):1900635. doi: 10.1080/2162402X.2021.1900635. Oncoimmunology. 2021. PMID: 33796412 Free PMC article.
-
Antigen presenting cells in cancer immunity and mediation of immune checkpoint blockade.Clin Exp Metastasis. 2024 Aug;41(4):333-349. doi: 10.1007/s10585-023-10257-z. Epub 2024 Jan 23. Clin Exp Metastasis. 2024. PMID: 38261139 Free PMC article. Review.
-
Randomized Phase II Trial and Tumor Mutational Spectrum Analysis from Cabozantinib versus Chemotherapy in Metastatic Uveal Melanoma (Alliance A091201).Clin Cancer Res. 2020 Feb 15;26(4):804-811. doi: 10.1158/1078-0432.CCR-19-1223. Epub 2019 Sep 26. Clin Cancer Res. 2020. PMID: 31558480 Free PMC article. Clinical Trial.
References
-
- Robert C, et al. KEYNOTE-006 investigators Pembrolizumab versus Ipilimumab in advanced melanoma. N Engl J Med. 2015;372(26):2521–2532. - PubMed
Publication types
MeSH terms
Substances
Grants and funding
LinkOut - more resources
Full Text Sources
Other Literature Sources
Medical
Research Materials

