. 2016 Oct 20;167(3):774-788.e17.
doi: 10.1016/j.cell.2016.10.002.

C9orf72 Dipeptide Repeats Impair the Assembly, Dynamics, and Function of Membrane-Less Organelles

Affiliations

C9orf72 Dipeptide Repeats Impair the Assembly, Dynamics, and Function of Membrane-Less Organelles

Kyung-Ha Lee et al. Cell. .

Abstract

Expansion of a hexanucleotide repeat GGGGCC (G4C2) in C9ORF72 is the most common cause of amyotrophic lateral sclerosis (ALS) and frontotemporal dementia (FTD). Transcripts carrying (G4C2) expansions undergo unconventional, non-ATG-dependent translation, generating toxic dipeptide repeat (DPR) proteins thought to contribute to disease. Here, we identify the interactome of all DPRs and find that arginine-containing DPRs, polyGly-Arg (GR) and polyPro-Arg (PR), interact with RNA-binding proteins and proteins with low complexity sequence domains (LCDs) that often mediate the assembly of membrane-less organelles. Indeed, most GR/PR interactors are components of membrane-less organelles such as nucleoli, the nuclear pore complex and stress granules. Genetic analysis in Drosophila demonstrated the functional relevance of these interactions to DPR toxicity. Furthermore, we show that GR and PR altered phase separation of LCD-containing proteins, insinuating into their liquid assemblies and changing their material properties, resulting in perturbed dynamics and/or functions of multiple membrane-less organelles.

Keywords: C9ORF72; amyotrophic lateral sclerosis; dipeptide repeat; membrane-less organelle; nucleolus; phase separation; stress granule.


Figures

Figure 1
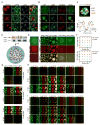
Figure 1. Proteomic analysis showing GR and PR share a common set of interactors enriched in LCDs
(A) GFP-GR50- and GFP-PR50-interacting proteins displayed by SAINT probabilistic score. Green, interactors with LCDs; gray, interactors without LCDs. (B) Venn diagram illustrating overlap (P < 1.17e-37, hypergeometric test) between GFP-GR50- and GFP-PR50-interacting proteins. (C) Percentage of LCD-containing proteins within the GR/PR interactome compared to percentage of LCD-containing proteins in the human proteome. (D) Gene ontology analysis showing enrichment in proteins that are components of membrane-less organelles. P values were derived via the DAVID algorithm. See also Figure S1.
Figure 2
Figure 2. Relevance of the GR/PR interactome to toxicity confirmed in Drosophila
(A) Eye phenotypes resulting from GMR-GAL4-driven expression of indicated transgenes at indicated temperatures. (B, C) Egg-to-adult viability phenotypes resulting from (B) OK371-GAL4-driven or (C) GMR-GAL4-driven expression of indicated transgenes at indicated temperatures. n=3 biological repeats, ****P < 0.0001 by Two Way ANOVA, Tukey’s post-hoc test. (D) MTT assay following ectopic expression of indicated DPR constructs in Neuro-2a cells. n=5 biological repeats, **P < 0.01, ***P < 0.001 by One Way ANOVA. (E) Schematic of a cell with membrane-less organelles related to the GR/PR interactome. Enhancers (red) and suppressors (green) of GR viability are categorized by membrane-less organelle. Data are represented as mean ± SEM in (B–D). See also Figure S2.
Figure 3
Figure 3. GR and PR dipeptides localize to nucleolar substructures and impair biophysical properties of NPM1 in vitro
(A) Cellular localization of mCherry- GR50 or -PR50 (red) and endogenous G3BP1 (green) in HeLa cells. DAPI is shown in blue. Scale bar, 10 μm. (B) Structured illumination microscopy showing sub-nucleolar localization of GFP-GR50 and -PR50 (green), UBF1 (cyan), and Fibrillarin (red) in HeLa cells. Nuclei were outlined based on DAPI stain (not shown). Scale bar, 1 μm. (C) GR localizes within GC and DFC, but is excluded from the FC. A representative line scan intensity graph of Fibrillarin and GFP-GR50 is displayed. Scale bar, 1 μm. (D) Schematic representation of LLPS mediated by NPM1 and R-rich motifs. NPM1 has N-terminal oligomerization domain (OD, gold), three acidic tracts (A1, A2, and A3, red) and one C-terminal RNA recognition motif (RRM, purple). (E) Poly-arginine peptides phase separate in vitro with NPM1 at 1:1 stoichiometry. Shown are confocal microscopy images of 20 μM NPM1, GR20 and PR20 (left panel) and binary mixtures of 20 μM NPM1 with 20 μM of the indicated peptide (right panels). 1 μM of the total NPM1 and each peptide was labeled with Alexa488 or TAMRA, respectively. Scale bar, 10 μm. (F) Phase diagrams for ternary mixtures of NPM1 (20 μM) with the indicated concentrations of SURF6 and GR20 (top) or SURF6 and PR20 (bottom). Single-phase regime (red diamonds) and two-phase regime with the formation of liquid droplets (green circles) are indicated. (G) GR20 (left) and PR20 (right) phase separate with NPM1 at 1:1 stoichiometry (DPR:NPM1) but not at higher stoichiometries. Alexa488-NPM1 was detected using confocal fluorescence microscopy. Scale bar, 10 μm. (H, I). Titrations of GR20 (H) and PR20 (I) (concentrations at top) into liquid-phase droplets comprised of 1:1 NPM1:SURF6 peptide prepared at different concentrations (indicated at left). Alexa488-NPM1 (left in each panel) and TAMRA-DPR peptides (middle) were detected using confocal fluorescence microscopy. Scale bar, 10 μm. See also Figures S3 and S4.
Figure 4
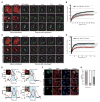
Figure 4. GR and PR dipeptides disrupt nucleolar dynamics and function in live cells
(A–D) HeLa cells transfected with (A, B) GFP-NPM1 or (C, D) GFP-NCL and mCherry-GR50 or -PR50 constructs were analyzed using FRAP. The yellow circle marks the photobleached region. Representative images of the same area before and after photobleaching are shown. Scale bar, 10 μm. Fluorescence of (B) GFP-NPM1 or (C) GFP-NCL in the photobleached region over time. n=10–12 cells per sample for GFP-NPM1; n=7–8 cells per sample for GFP-NCL, ***P < 0.001 by Student t-test, paired. (E) Average diameter of the nucleolar fibrillar center (FC) is shown following expression of GFP-GR50 or PR50 dipeptides or controls. P < 0.01, ANOVA. Scale bar, 1 μm. At least 12 cells were analyzed for each condition (n=2 biological repeats). Representative line scan intensity graphs of FC surrounded by DFC are displayed. (F) rRNA-specific antibody (red) shows rRNA levels in HeLa cells transiently transfected with GFP-GR50 or -PR50 or GFP alone. (G) Quantification of cells showing the percentage of normal (gray) and reduced (white) immunostaining of rRNA relative to neighboring untransfected cells. n=3 biological repeats, ***P < 0.001 by One Way ANOVA. Scale bar, 10 μm. Data are represented as mean ± SEM in (B), (D) and (E). See also Figure S4.
Figure 5
Figure 5. GR and PR dipeptides promote spontaneous assembly of poorly dynamic stress granules and inhibit cellular translation
(A) Cellular localization of GFP-GR50, GFP-PR50, or GFP and endogenous TDP-43 (red) and eIF4G (purple) in HeLa cells. DAPI is shown in blue. Scale bar, 10 μm. (B) Percentage of cells containing stress granules in HeLa or U2-OS cells following expression of GFP, GFP-GR50 or GFP-PR50. n=2 biological repeats. (C) Stress granule dynamics in HeLa cells as visualized by G3BP1-GFP (green) and mCherry, mCherry-GR50 or mCherry-PR50 (red). Live cells were imaged continuously over 14 hours (also see Movies S1–S3). White arrows, cells with stress granules at the beginning of imaging; yellow arrows, cells spontaneously forming stress granules during imaging. Scale bar, 10 μm. (D) Hazard analysis demonstrating risk of stress granule formation and cell death. ***P < 0.0001 by Log-rank test. (E) Translation efficiency in HeLa cells as visualized by measuring puromycin (red) incorporation into nascent peptides; GFP (green), EIF4G (purple). Scale bar, 10 μm. (F) Quantification of translation in HeLa cells as visualized in (E). n=3 biological repeats, ***P < 0.001 by One Way ANOVA. (G) Translational inhibition as assessed by metabolic assay monitoring incorporation of S35 into newly translated proteins. n=5 biological repeats, ***P < 0.001, **P < 0.01, *P < 0.05, Two Way ANOVA, Dunnett’s post-hoc test. Data are represented as mean ± SEM in (F) and (G). See also Figure S5 and Movies S1–S3.
Figure 6
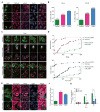
Figure 6. GR and PR dipeptides alter biophysical properties of hnRNPA1 and TIA-1 and alter stress granule dynamics in live cells
(A) Schematic of hnRNPA1. RRM, RNA-recognition motif; LCD, low-complexity sequence domain. (B) Incorporation of DPRs into phase-separated liquid droplets of hnRNPA1. Fluorescence images of hnRNPA1 (DIC) mixed with TAMRA-labeled polypeptides. Scale bar, 10 μm. (C) Phase diagram of hnRNPA1 as a function of concentration of protein concentration and polypeptides concentration. GR20 and PR20 significantly shift the phase diagram. Red and green symbols indicate that the samples are shown as being in either was in the one-phase (red) or the two-phase (green) regime, respectively. (D) Schematic of TIA-1. (E) Incorporation of DPRs into phase-separated liquid droplets of TIA-1. Fluorescence images of TIA-1 (DIC) mixed with TAMRA-labeled polypeptides. Scale bar, 10 μm. (F) Phase diagram of TIA-1 using the same analysis as for (C). (G) G3BP1-GFP-transfected HeLa cells were either treated with NaAsO2 to induce stress granules or co-transfected with mCherry-GR50, followed by photobleaching (yellow circle) and monitoring for fluorescence recovery. Scale bar, 10 μm. (H) Fluorescence of the photobleached region over time. Data are represented as mean ± SEM for n=7–8, ***P < 0.001 by Student t-test, paired. See also Figure S6 and Movies S4–S5.
Figure 7
Figure 7. GR and/or PR dipeptides impair the assembly or dynamics of other membrane-less organelles
(A) Nuclear speckle dynamics in HeLa cells transfected with SRSF7-GFP and mCherry-GR50 or -PR50 constructs were analyzed using FRAP. The yellow circle marks the photobleached region. Representative images of the same area before and after photobleaching are shown. Scale bar, 10 μm. (B) Fluorescence of SRSF7-GFP in the photobleached region over time. Data are represented as mean ± SEM for n=10, ***P < 0.001 by Student t-test, paired. (C) Assembly of Cajal bodies in HeLa cells transfected with mCherry-PR50 or -GR50 were immunostained with anti-Coilin antibody. For panels a – c (Coilin staining), magnified images are shown on the right. Scale bar, 10 μm. See also Figure S7.

Similar articles

Cited by

References

    1. Alami NH, Smith RB, Carrasco MA, Williams LA, Winborn CS, Han SS, Kiskinis E, Winborn B, Freibaum BD, Kanagaraj A, et al. Axonal transport of TDP-43 mRNA granules is impaired by ALS-causing mutations. Neuron. 2014;81:536–543. - PMC - PubMed
    1. Anderson P, Kedersha N. RNA granules: post-transcriptional and epigenetic modulators of gene expression. Nat Rev Mol Cell Biol. 2009;10:430–436. - PubMed
    1. Boisvert FM, van Koningsbruggen S, Navascues J, Lamond AI. The multifunctional nucleolus. Nat Rev Mol Cell Biol. 2007;8:574–585. - PubMed
    1. Brangwynne C, Tompa P, Pappu R. Polymer physics of intracellular phase transitions. NATURE PHYSICS. 2015;11:899–904.
    1. Brangwynne CP, Mitchison TJ, Hyman AA. Active liquid-like behavior of nucleoli determines their size and shape in Xenopus laevis oocytes. Proc Natl Acad Sci U S A. 2011;108:4334–4339. - PMC - PubMed

Publication types

MeSH terms