Genomic and Transcriptomic Features of Response to Anti-PD-1 Therapy in Metastatic Melanoma
- PMID: 26997480
- PMCID: PMC4808437
- DOI: 10.1016/j.cell.2016.02.065
Genomic and Transcriptomic Features of Response to Anti-PD-1 Therapy in Metastatic Melanoma
Erratum in
-
Genomic and Transcriptomic Features of Response to Anti-PD-1 Therapy in Metastatic Melanoma.Cell. 2017 Jan 26;168(3):542. doi: 10.1016/j.cell.2017.01.010. Cell. 2017. PMID: 28129544 No abstract available.
Abstract
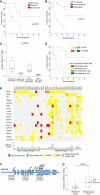
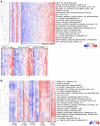
PD-1 immune checkpoint blockade provides significant clinical benefits for melanoma patients. We analyzed the somatic mutanomes and transcriptomes of pretreatment melanoma biopsies to identify factors that may influence innate sensitivity or resistance to anti-PD-1 therapy. We find that overall high mutational loads associate with improved survival, and tumors from responding patients are enriched for mutations in the DNA repair gene BRCA2. Innately resistant tumors display a transcriptional signature (referred to as the IPRES, or innate anti-PD-1 resistance), indicating concurrent up-expression of genes involved in the regulation of mesenchymal transition, cell adhesion, extracellular matrix remodeling, angiogenesis, and wound healing. Notably, mitogen-activated protein kinase (MAPK)-targeted therapy (MAPK inhibitor) induces similar signatures in melanoma, suggesting that a non-genomic form of MAPK inhibitor resistance mediates cross-resistance to anti-PD-1 therapy. Validation of the IPRES in other independent tumor cohorts defines a transcriptomic subset across distinct types of advanced cancer. These findings suggest that attenuating the biological processes that underlie IPRES may improve anti-PD-1 response in melanoma and other cancer types.
Copyright © 2016 Elsevier Inc. All rights reserved.
Figures


Comment in
-
Immunotherapy: Dressed to ImPRESs.Nat Rev Clin Oncol. 2016 May;13(5):263. doi: 10.1038/nrclinonc.2016.55. Epub 2016 Apr 13. Nat Rev Clin Oncol. 2016. PMID: 27071347 No abstract available.
Comment on
-
A Set of Transcriptomic Changes Is Associated with Anti-PD-1 Resistance.Cancer Discov. 2016 May;6(5):472. doi: 10.1158/2159-8290.CD-RW2016-057. Epub 2016 Mar 31. Cancer Discov. 2016. PMID: 27034380
Similar articles
-
The Next Immune-Checkpoint Inhibitors: PD-1/PD-L1 Blockade in Melanoma.Clin Ther. 2015 Apr 1;37(4):764-82. doi: 10.1016/j.clinthera.2015.02.018. Epub 2015 Mar 29. Clin Ther. 2015. PMID: 25823918 Free PMC article. Review.
-
Checkpoint inhibition for advanced mucosal melanoma.Eur J Dermatol. 2017 Apr 1;27(2):160-165. doi: 10.1684/ejd.2016.2949. Eur J Dermatol. 2017. PMID: 28174141
-
[Immune checkpoint antibodies increase survival in patients with metastatic melanoma].Ugeskr Laeger. 2016 Aug 15;178(33):V01160070. Ugeskr Laeger. 2016. PMID: 27550784 Review. Danish.
-
Management of Adverse Events Following Treatment With Anti-Programmed Death-1 Agents.Oncologist. 2016 Oct;21(10):1230-1240. doi: 10.1634/theoncologist.2016-0055. Epub 2016 Jul 8. Oncologist. 2016. PMID: 27401894 Free PMC article. Review.
-
Prognostic factors and outcomes in metastatic uveal melanoma treated with programmed cell death-1 or combined PD-1/cytotoxic T-lymphocyte antigen-4 inhibition.Eur J Cancer. 2017 Sep;82:56-65. doi: 10.1016/j.ejca.2017.05.038. Epub 2017 Jun 22. Eur J Cancer. 2017. PMID: 28648699
Cited by
-
Notch1 blockade by a novel, selective anti-Notch1 neutralizing antibody improves immunotherapy efficacy in melanoma by promoting an inflamed TME.J Exp Clin Cancer Res. 2024 Nov 4;43(1):295. doi: 10.1186/s13046-024-03214-5. J Exp Clin Cancer Res. 2024. PMID: 39491031 Free PMC article.
-
Identification of mutational signature for lung adenocarcinoma prognosis and immunotherapy prediction.J Mol Med (Berl). 2022 Dec;100(12):1755-1769. doi: 10.1007/s00109-022-02266-4. Epub 2022 Nov 11. J Mol Med (Berl). 2022. PMID: 36367565
-
A pan-cancer cuproptosis signature predicting immunotherapy response and prognosis.Heliyon. 2024 Jul 30;10(15):e35404. doi: 10.1016/j.heliyon.2024.e35404. eCollection 2024 Aug 15. Heliyon. 2024. PMID: 39170145 Free PMC article.
-
Update on Poly-ADP-ribose polymerase inhibition for ovarian cancer treatment.J Transl Med. 2016 Sep 15;14:267. doi: 10.1186/s12967-016-1027-1. J Transl Med. 2016. PMID: 27634150 Free PMC article. Review.
-
PDIA5 is Correlated With Immune Infiltration and Predicts Poor Prognosis in Gliomas.Front Immunol. 2021 Feb 16;12:628966. doi: 10.3389/fimmu.2021.628966. eCollection 2021. Front Immunol. 2021. PMID: 33664747 Free PMC article.
References
Publication types
MeSH terms
Substances
Grants and funding
LinkOut - more resources
Full Text Sources
Other Literature Sources
Medical
Miscellaneous

