. 2015 Sep;17(9):1099-111.
doi: 10.1038/ncb3217. Epub 2015 Aug 17.

Distinct regulatory mechanisms governing embryonic versus adult adipocyte maturation

Affiliations

Distinct regulatory mechanisms governing embryonic versus adult adipocyte maturation

Qiong A Wang et al. Nat Cell Biol. 2015 Sep.

Abstract

Pathological expansion of adipose tissue contributes to the metabolic syndrome. Distinct depots develop at various times under different physiological conditions. The transcriptional cascade mediating adipogenesis is established in vitro, and centres around a core program involving PPARγ and C/EBPα. We developed an inducible, adipocyte-specific knockout system to probe the requirement of key adipogenic transcription factors at various stages of adipogenesis in vivo. C/EBPα is essential for all white adipogenic conditions in the adult stage, such as adipose tissue regeneration, adipogenesis in muscle and unhealthy expansion of white adipose tissue during high-fat feeding or due to leptin deficiency. Surprisingly, terminal embryonic adipogenesis is fully C/EBPα independent, but does however depend on PPARγ; cold-induced beige adipogenesis is also C/EBPα independent. Moreover, C/EBPα is not vital for adipocyte survival in the adult stage. We reveal a surprising diversity of transcriptional signals required at different stages of adipogenesis in vivo.


Figures
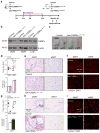
Figure 1
Figure 1. C/EBPα is not required for terminal embryonic adipogenesis
a. Experimental design: Adn-C/EBPαflox/flox or control littermates (mice contains only Adn-rtTA and C/EBPαflox/flox) of both genders, Adn-PPARγflox/flox male mice and control littermates (mice carrying only Adn-rtTA and PPARγflox/flox) were on doxycycline (dox) chow diet during E11–P16. After P16, they were switched to normal chow diet to generate Adn-C/EBPα−/−(E11-P16) or Adn-PPARγ−/−(E11-P16) mice. b. Western-blot of C/EBPα levels in protein extracts of sWAT, eWAT and liver from Adn-C/EBPα−/−(E11-P16) male mice and their control male littermates at 7 weeks of age. 2 male mice per group. These images are from a single Western-blot experiment. c. Whole tissue pictures of eWAT and sWAT from Adn-C/EBPα−/−(E11-P16) male mice and their control male littermates at 7 weeks of age. These images are from a single experiment. d. sWAT and eWAT tissue mass (top) and average adipocyte size (bottom) of Adn-C/EBPα−/−(E11-P16) male mice and their control male littermates at 7 weeks of age. For adipose tissue mass, n = 5 male mice (10 fat depots, control group), n = 3 male mice (6 fat depots, Adn-C/EBPα−/−(E11-P16) group). This experiment is representative of two independent experiments. For adipocyte size, n = 339 cells (control, sWAT); 408 cells (Adn-C/EBPα−/−(E11-P16), sWAT); 338 cells (control, eWAT); 323 cells (Adn-C/EBPα−/−(E11-P16), eWAT). Data represent the mean ± s.e.m. Student’s t-test. This data is from a single experiment. e, f. H&E staining (e) and perilipin (red)/DAPI (blue) immunofluorescence staining (f) in sWAT and eWAT in Adn-C/EBPα−/−(E11-P16) male mice and their control male littermates. These images are representative of two independent experiments. g. sWAT and eWAT tissue mass (top) and average adipocyte size (bottom) of Adn-PPARγ−/−(E11-P16) male mice and their control male littermates were measured when they were 10 weeks of old. For tissue mass, n = 4 male mice (8 fat depots, control group), n = 3 male mice (6 fat depots, Adn- PPARγ−/−(E11-P16) group). **, P <0.001 for sWAT; *, P = 0.04 for eWAT. This experiment is representative of two independent experiments. For average adipocyte size, n = 335 cells (control, eWAT); 245 cells (Adn- PPARγ−/−(E11-P16), eWAT. **, P <0.001. All compared to control group. All data represent the mean ± s.e.m. Student’s t-test. h, i. H&E (h) and perilipin (red)/DAPI (blue) immunofluorescence staining (i) shows the adipocyte morphology in sWAT and eWAT of Adn-PPARγ−/−(E11-P16) male mice, compared to their control male littermates. These image are representative of two independent experiments.
Figure 2
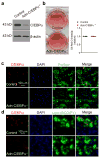
Figure 2. C/EBPα deficient adipocytes are viable and have normal lipid accumulation in vitro
a. Western-blots of C/EBPα in protein extracts of differentiated adipocytes from SVF of Adn-C/EBPαflox/flox mice or control littermates, treated with doxycycline for 3 days. These images are representative of two independent Western-blot experiments. b. Oil red O staining on differentiated adipocytes from SVF of Adn-C/EBPαflox/flox mice or control littermates, treated with doxycycline for 3 days (left). Relative Oil Red O intensity was measured by ImageJ software (right). n = 3 wells of a six-well plate for each group. This experiment is representative of three independent experiments. c, d. immunofluorescence stains for C/EBPα (red), DAPI (blue) and perilipin (green) (c) or C/EBPα (red), DAPI (blue) and BODIPY (green) (d) on differentiated adipocytes treated with doxycycline for 3 days. These images are representative of two independent experiments.
Figure 3
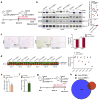
Figure 3. Normal viability and lipid accumulation in inducible C/EBPα deficient adipocytes in vivo
a. Experimental design: Adn-C/EBPαflox/flox mice started doxycycline chow diet treatment on 10 weeks of age to generate Adn-C/EBPα−/− mice. b. Western-blots of phospho-Akt (Ser473), total Akt, phospho-Erk1/2 (Thr202/Tyr204) and total Erk1/2 levels in protein extracts of sWAT, eWAT and liver from Adn-C/EBPα−/− mice and their control littermates after 4 days of doxycycline chow diet feeding. n = 2 male mice per group. The bar graphs indicate the fold stimulation of pAkt and pErk1/2 phosphorylation relative to tAkt and tErk1/2. Data represent the mean. These images are representative of two independent Western-blot experiments. c. H&E staining (left) and average adipocyte size (right) in sWAT and eWAT of both groups after 1 month of doxycycline HFD feeding. These images are representative of two independent experiments. For adipocyte sizes, n = 154 cells (control, sWAT); 192 cells (Adn-C/EBPα−/−, sWAT); 76 cells (control, eWAT); 86 cells (Adn-C/EBPα−/−, eWAT). All data represent the mean ± s.e.m.. All from one image shown in the figure. This data is from a single experiment. d. Western-blot of circulating adiponectin after 1–8 days of doxycycline chow diet feeding and quantification (left). Relative protein levels were determined by densitometry quantification of the immunoblots after normalization to IgG light chain (LgGLC) (right). n = 2 male mice per group. Data represent the mean. Theses image is representative of three independent Western-blot experiments. e, f. Circulating adiponectin levels tested by ELISA in Adn-C/EBPα−/−(E11-P16) male mice (e), Adn-PPARγ−/−(E11-P16) male mice (f) and their control male littermates at 8 weeks of age. n = 5 male mice (control group for both e and f), n = 3 male mice (Adn-C/EBPα−/−(E11-P16) group), n = 9 male mice (Adn-PPARγ−/−(E11-P16) group). *, P = 0.01 for Adn-C/EBPα−/−(E11-P16) mice; **, P = 0.008 for Adn-PPARγ−/−(E11-P16) mice. All data represent the mean ± s.e.m. Student’s t-test. g. Experimental design: for microarray analysis, 10 weeks old Adn-C/EBPαflox/flox male mice or Adn-PPARγflox/flox male mice and their control male littermates were kept on doxycycline chow diet for 3 days to generate Adn-C/EBPα−/− or Adn-PPARγ−/− mice. n = 14, control group for Adn-PPARγ−/−; n = 10, Adn-PPARγ−/− group and control group for Adn-C/EBPα−/−; n = 12, Adn-C/EBPα−/− group. h. Overlap of C/EBPα direct responsive genes and PPARγ direct responsive genes. P cut-off: 0.05; fold change cut-off: 1.5. Student’s t-test. This data is from a single experiment.
Figure 4
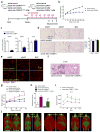
Figure 4. Mice with inducible C/EBPα elimination in adipocytes have impaired glucose and lipid metabolism during high fat diet challenge
a. Experimental design: Adn-C/EBPαflox/flox mice started doxycycline (dox) HFD treatment at10 weeks of age to generate HFD Adn-C/EBPα−/− mice. b. Body weights of both groups during doxycycline HFD feeding. n = 6 male mice (HFD control group), n = 11 male mice (HFD Adn-C/EBPα−/− group). *, P = 0.02 at day 34; **, P <0.001 at day 38; **, P <0.001 at day 44, compared to HFD control group. Data represent the mean ± s.e.m. Student’s t-test. This experiment is representative of three independent experiments. c. Magnetic resonance imaging analysis of both groups after 4 weeks of doxycycline HFD feeding. Red mass represents adipose tissue. These images are from a single experiment. d. NMR body fat and lean content of both groups after 4 weeks of doxycycline HFD feeding. n = 11 male mice per group. Data represent the mean ± s.e.m. This data is from a single experiment. e. H&E staining (left) in sWAT, eWAT and BAT and average adipocyte size (right) of sWAT and eWAT, as indicated, of both groups after 4 weeks of doxycycline HFD feeding. These images are representative of two independent experiments. For adipocyte sizes, n = 53 cells (HFD control, sWAT); 42 cells (HFD Adn-C/EBPα−/−, sWAT); 43 cells (HFD control, eWAT); 47 cells (HFD Adn-C/EBPα−/−, eWAT). All data represent the mean ± s.e.m. Student’s t-test. All from one image shown in the figure. This data is from a single experiment. f. Immunofluorescence staining for perilipin (red) and DAPI (blue) in sWAT, eWAT and BAT, as indicated, of both groups after 4 weeks of doxycycline HFD feeding. This image is representative of two independent experiments. g, h. GTT (f) and ITT (g) were performed during the 4th and 6th week of doxycycline HFD feeding on Adn-C/EBPα−/− mice and their control littermates, the bar graph represents the area under the curve. For GTT, n = 10 male mice (HFD control group), n = 8 male mice (HFD Adn-C/EBPα−/− group). For ITT, n = 7 male mice (HFD control group), n = 6 male mice (HFD Adn-C/EBPα−/− group). *, P = 0.047, 0.039 for GTT 30, 90 minutes; **, P = 0.001 for GTT 60 minutes; *, P = 0.01 for GTT AUC; *, P = 0.048 for ITT 15, 60 minutes, *, P = 0.04 for ITT AUC, compared to HFD control group. All data represent the mean ± s.e.m. Two-way ANOVA. These experiment are all representative of two independent experiments.
Figure 5
Figure 5. Inducible deletion of C/EBPα in adipocytes of ob/ob mice attenuates adipose tissue expansion, which can be rescued by adiponectin overexpression
a. Experimental design: ob/ob Adn-C/EBPαflox/flox mice or ob/ob Adn-C/EBPαflox/flox AdTg mice started doxycycline chow diet treatment at 6 weeks of age to generate ob/ob Adn-C/EBPα−/− mice or ob/ob Adn-C/EBPα−/− AdTg mice. b. Body weights during doxycycline chow diet feeding. n = 5 male mice per group. **, P <0.001 at day 41, 62, 83, 108 and 136. Student’s t-test. This experiment is representative of two independent experiments. c. sWAT, eWAT and liver tissue weight. n = 5 male mice per group. **, P <0.001, compared to ob/ob control group. Student’s t-test. This experiment is representative of two independent experiments. d. H&E staining (left) of sWAT, eWAT and BAT, and average adipocyte size (right) of sWAT and eWAT, as indicated. These images are representative of two independent experiments. For adipocyte sizes, n = 105 cells (ob/ob control, sWAT); 60 cells (ob/ob Adn-C/EBPα−/−, sWAT); 80 cells (ob/ob control, eWAT); 89 cells (ob/ob Adn-C/EBPα−/−, eWAT). All data represent the mean ± s.e.m. Student’s t-test. All from one image shown in the figure. This data is from a single experiment.. e. Immunofluorescence staining for perilipin (red) and DAPI (blue) in sWAT, eWAT and BAT. These images are representative of two independent experiments. f. H&E staining of liver. These images are representative of two independent experiments. g. Body weights during doxycycline chow diet feeding. n = 3 male mice (ob/ob control group, ob/ob control AdTg group and ob/ob Adn-C/EBPα−/− group), n = 7 male mice (ob/ob Adn-C/EBPα−/− AdTg group). *, P = 0.03, 0.02 at day 54 and 73 for ob/ob control AdTg compared to ob/ob control group. *, P = 0.03, 0.01 at day 33 and 54; **, P <0.001 at day 73 for ob/ob Adn-C/EBPα−/− compared to ob/ob control group. Data represent the mean ± s.e.m. Student’s t-test. This experiment is representative of two independent experiments. h. Circulating adiponectin levels tested by ELISA. n = 2 male mice (ob/ob control group), n = 8 male mice (ob/ob control AdTg group), n = 5 male mice (ob/ob Adn-C/EBPα−/− group), n = 6 male mice (ob/ob Adn-C/EBPα−/− AdTg group). ##, P <0.001 compared to ob/ob control AdTg group. Data represent the mean ± s.e.m. Student’s t-test. This data is from a single experiment. i. GTT performed during the 10th week of doxycycline chow diet. n = 13 male mice (ob/ob control AdTg group), n = 12 male mice (ob/ob Adn-C/EBPα−/− AdTg group). *, P = 0.02, at 60 minutes; **, P = 0.001 at 30 minutes compared to ob/ob control AdTg group. Data represent the mean ± s.e.m. Two-way ANOVA. This data is from a single experiment. j. Magnetic resonance imaging analysis at the 8th week of doxycycline chow diet feeding. These images are from a single experiment.
Figure 6
Figure 6. C/EBPα is required for terminal white adipogenesis in the adult stage
a. Experimental design: FAT-ATTAC/Adn-C/EBPαflox/flox mice were kept on chow diet before dimerization. After dimerization at 10 weeks of age, mice were kept on chow diet (FAT-ATTAC/Adn-C/EBPαflox/flox) or switched to doxycycline chow diet (FAT-ATTAC/Adn-C/EBPα−/−) for up to 6 weeks. b. Perilipin (red) and DAPI (blue) immunofluorescence staining in sWAT and eWAT of FAT-ATTAC/Adn-C/EBPαflox/flox mice before dimerization, 7 days after dimerization without doxycycline treatment, 6 weeks after dimerization without doxycycline treatment (FAT-ATTAC/Adn-C/EBPαflox/flox) or with doxycycline treatment (FAT-ATTAC/Adn-C/EBPα−/−). These images are representative of two independent experiments. c. Whole tissue pictures of sWAT and eWAT of FAT-ATTAC/Adn-C/EBPαflox/flox mice 7 days post dimerization (without doxycycline treatment) (III), compared to FAT-ATTAC/Adn-C/EBPαflox/flox littermate without dimerization and doxycycline treatment (I), or FAT-ATTAC/Adn-C/EBPα−/− littermate with doxycycline treatment (II) but without dimerization. These images are representative of two independent experiments. d. Whole tissue pictures of sWAT and eWAT of FAT-ATTAC/Adn-C/EBPαflox/flox mice (without dox) (II) and FAT-ATTAC/Adn-C/EBPα−/− littermate (with dox) (III) 4 weeks post dimerization, compared to FAT-ATTAC/Adn-C/EBPαflox/flox littermate without dimerization and doxycycline treatment (I). These images are representative of two independent experiments. e–g. Experimental design: Adn-C/EBPαflox/flox male mice and their control male littermates at 10 weeks of age were injected with glycerol intramuscularly into the right side of tibialis anterior muscle to induce muscle injury, while PBS was injected to the left side of tibialis anterior muscle as vehicle control (e). 3 weeks after glycerol injection, representative H&E staining shows the tissue morphology and adipocyte (arrows) in tibialis anterior muscles These images are representative of two independent experiments. (f). qPCR analysis shows the mRNA expression levels of adipocyte markers adipsin and adiponectin in muscles injected with PBS or glycerol, both in Adn-C/EBPα−/− mice and their control littermates (g). n = 5 mice per group. Data represent the mean ± s.e.m. **, P = 0.008; *, P = 0.01 (adipsin) compared to control PBS group; #, P = 0.02; #, P = 0.04 (adiponectin) compared to Adn-C/EBPα−/− PBS group. Student’s t-test. This experiment is representative of two independent experiments.
Figure 7
Figure 7. Terminal beige adipogenesis does not depend on C/EBPα
a. Experimental design: Adn-C/EBPαflox/flox male mice and their control male littermates at 10 weeks of age were exposed to cold temperature (6°C) and switched from chow diet to doxycycline chow diet at the same time for 10 days. b. qPCR analysis shows the mRNA expression levels of beige adipocyte markers Ucp1 and Tmem26, as well as C/EBPα in sWAT of Adn-C/EBPα−/− mice and their control littermates. n = 4 male mice (control group), n = 2 male mice (Adn-C/EBPα−/− group). Data represent the mean. This experiment is representative of two independent experiments. c, d. H&E staining shows the adipocyte morphology in sWAT and eWAT of both groups (c). Immunofluorescence staining shows UCP1 (green), perilipin (red) and DAPI (blue) in sWAT of both groups (d). These images are representative of two independent experiments.
Figure 8
Figure 8. The complexity of adipogenesis in vivo
A Schematic summary of the complexity of adipogenesis in vivo: C/EBPα is not universally required for all adipogenic conditions. First of all, terminal adipocyte differentiation in sWAT during embryonic development is fully C/EBPα independent. In contrast, C/EBPα is essential for all the terminal white adipogenesis conditions in the adult stage we had tested. These conditions are: adipose tissue expansion during HFD feeding or in leptin deficient mice, regeneration of adipose tissue after ablation and muscle tissue adipogenesis after injury. However, in the adult stage, C/EBPα expression is also not required for cold-induced beige adipogenesis. Our data suggests that white adipocyte precursors in adult animal respond to distinct signals, different from white adipocyte precursors in embryogenesis or beige adipocyte precursors.

Similar articles

Cited by

References

    1. Scherer PE. Adipose tissue: from lipid storage compartment to endocrine organ. Diabetes. 2006;55:1537–1545. - PubMed
    1. Rosen ED, Spiegelman BM. Adipocytes as regulators of energy balance and glucose homeostasis. Nature. 2006;444:847–853. - PMC - PubMed
    1. Cinti S. The adipose organ at a glance. Disease Models & Mechanisms. 2012;5:588–594. - PMC - PubMed
    1. Abate N, Garg A, Peshock R, Stray-Gunderson J, Grundy S. Relationship of generalized and original adiposity to insulin sensitivity in men. J Clin Invest. 1995;96:88–98. - PMC - PubMed
    1. Miyazaki Y, DeFronzo R. Visceral fat dominant distribution in male type 2 diabetic patients is closely related to hepatic insulin resistance, irrespective of body type. Cardiovascular Diabetology. 2009;8:44. - PMC - PubMed

Publication types

LinkOut - more resources