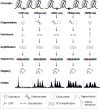
Identifying and mitigating bias in next-generation sequencing methods for chromatin biology
- PMID: 25223782
- PMCID: PMC4473780
- DOI: 10.1038/nrg3788
Identifying and mitigating bias in next-generation sequencing methods for chromatin biology
Abstract
Next-generation sequencing (NGS) technologies have been used in diverse ways to investigate various aspects of chromatin biology by identifying genomic loci that are bound by transcription factors, occupied by nucleosomes or accessible to nuclease cleavage, or loci that physically interact with remote genomic loci. However, reaching sound biological conclusions from such NGS enrichment profiles requires many potential biases to be taken into account. In this Review, we discuss common ways in which biases may be introduced into NGS chromatin profiling data, approaches to diagnose these biases and analytical techniques to mitigate their effect.
Figures


Similar articles
-
ChIP-Seq: Library Preparation and Sequencing.Methods Mol Biol. 2016;1402:101-117. doi: 10.1007/978-1-4939-3378-5_9. Methods Mol Biol. 2016. PMID: 26721486
-
Unified Analysis of Multiple ChIP-Seq Datasets.Methods Mol Biol. 2021;2198:451-465. doi: 10.1007/978-1-0716-0876-0_33. Methods Mol Biol. 2021. PMID: 32822050
-
Next-generation sequencing applied to flower development: ChIP-Seq.Methods Mol Biol. 2014;1110:413-29. doi: 10.1007/978-1-4614-9408-9_24. Methods Mol Biol. 2014. PMID: 24395273
-
Tn5 Transposase Applied in Genomics Research.Int J Mol Sci. 2020 Nov 6;21(21):8329. doi: 10.3390/ijms21218329. Int J Mol Sci. 2020. PMID: 33172005 Free PMC article. Review.
-
Library preparation methods for next-generation sequencing: tone down the bias.Exp Cell Res. 2014 Mar 10;322(1):12-20. doi: 10.1016/j.yexcr.2014.01.008. Epub 2014 Jan 15. Exp Cell Res. 2014. PMID: 24440557 Review.
Cited by
-
Unraveling the 3D genome: genomics tools for multiscale exploration.Trends Genet. 2015 Jul;31(7):357-72. doi: 10.1016/j.tig.2015.03.010. Epub 2015 Apr 14. Trends Genet. 2015. PMID: 25887733 Free PMC article. Review.
-
Paired-end mappability of transposable elements in the human genome.Mob DNA. 2019 Jul 10;10:29. doi: 10.1186/s13100-019-0172-5. eCollection 2019. Mob DNA. 2019. PMID: 31320939 Free PMC article.
-
An ATAC-seq atlas of chromatin accessibility in mouse tissues.Sci Data. 2019 May 20;6(1):65. doi: 10.1038/s41597-019-0071-0. Sci Data. 2019. PMID: 31110271 Free PMC article.
-
Integrating ChIP-seq with other functional genomics data.Brief Funct Genomics. 2018 Mar 1;17(2):104-115. doi: 10.1093/bfgp/ely002. Brief Funct Genomics. 2018. PMID: 29579165 Free PMC article. Review.
-
BIDCHIPS: bias decomposition and removal from ChIP-seq data clarifies true binding signal and its functional correlates.Epigenetics Chromatin. 2015 Sep 17;8:33. doi: 10.1186/s13072-015-0028-2. eCollection 2015. Epigenetics Chromatin. 2015. PMID: 26388941 Free PMC article.
References
Publication types
MeSH terms
Substances
Grants and funding
LinkOut - more resources
Full Text Sources
Other Literature Sources

