. 2013 Dec 5;504(7478):113-8.
doi: 10.1038/nature12823.

TRPV1 structures in distinct conformations reveal activation mechanisms

Affiliations

TRPV1 structures in distinct conformations reveal activation mechanisms

Erhu Cao et al. Nature. .

Abstract

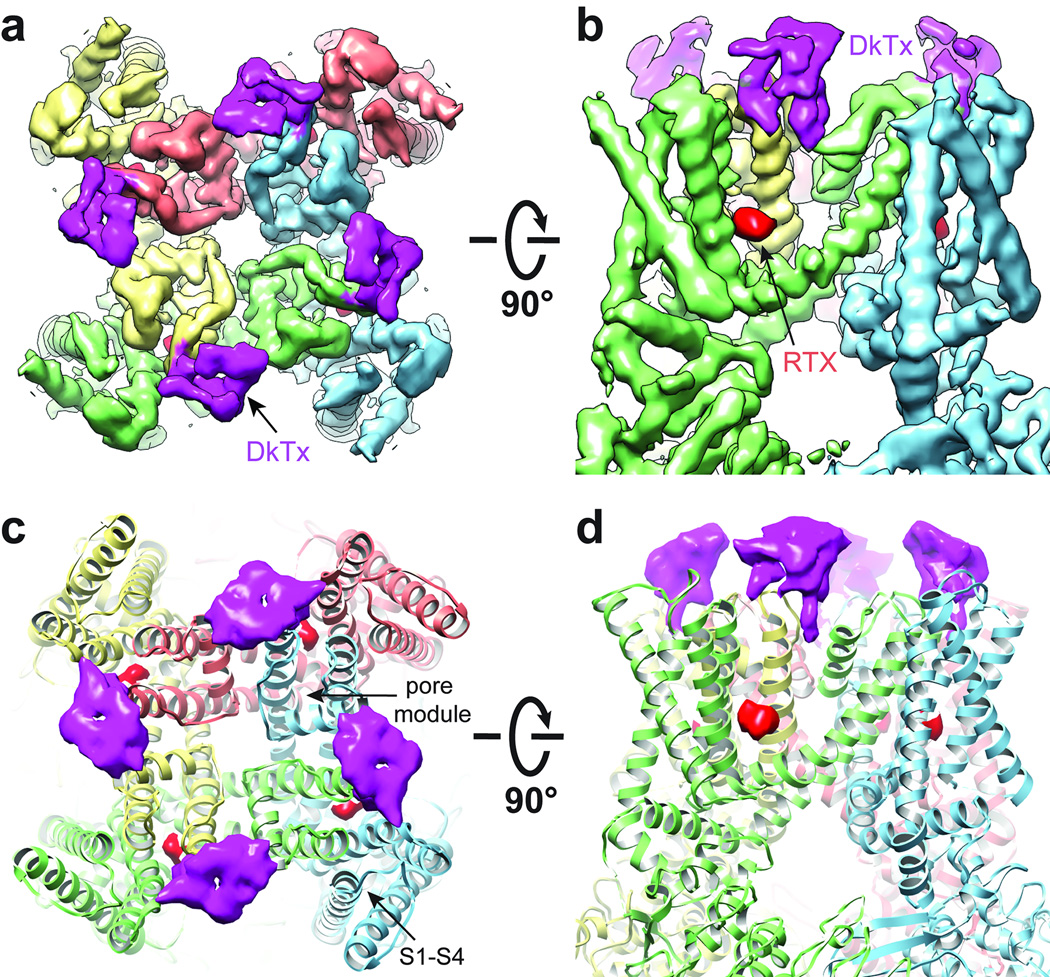
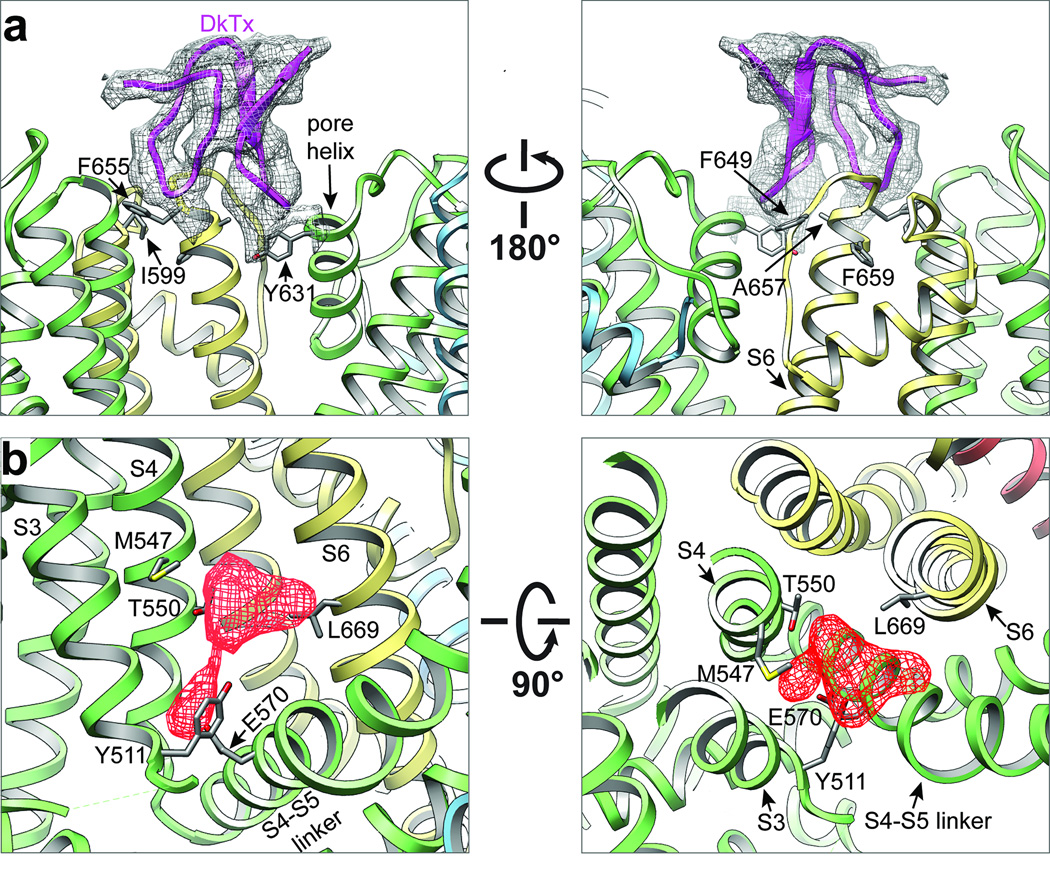
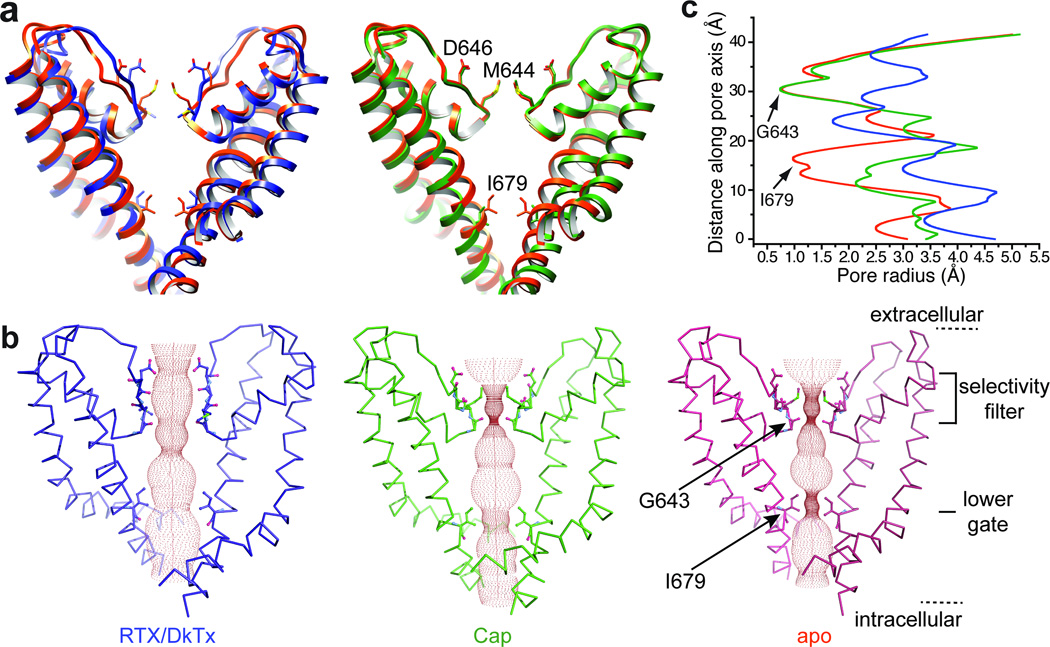
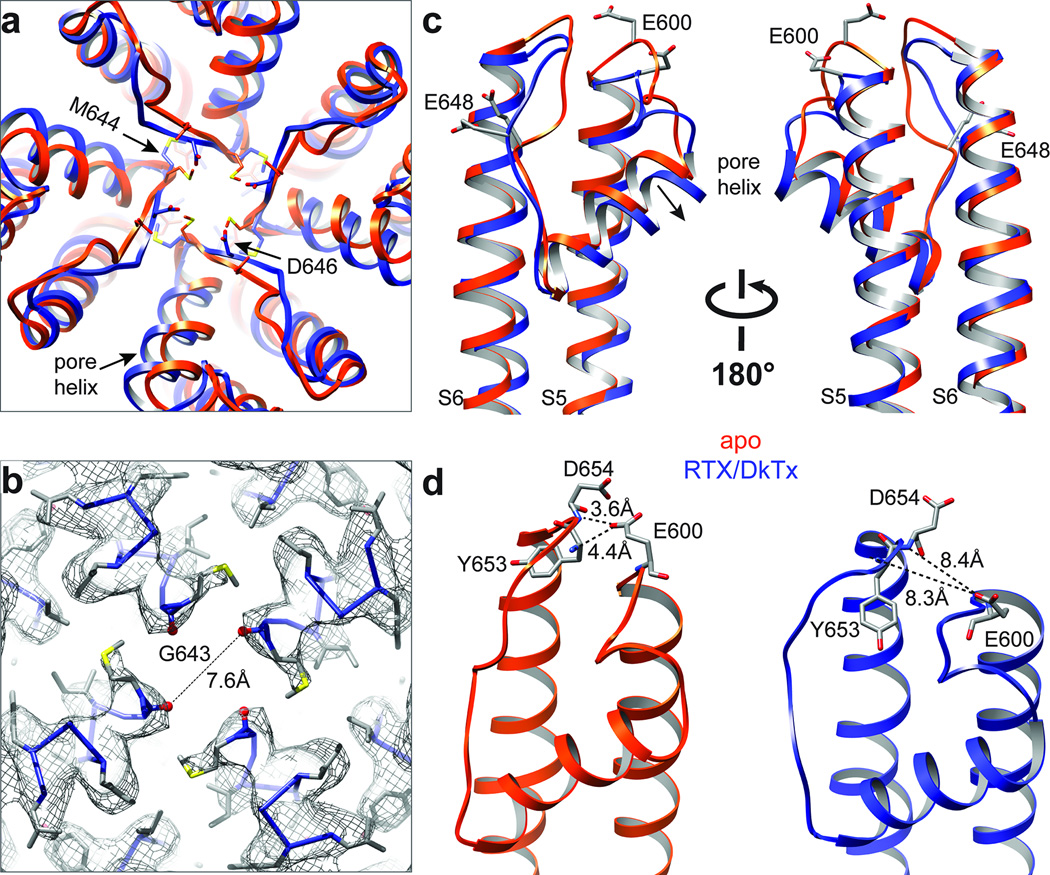
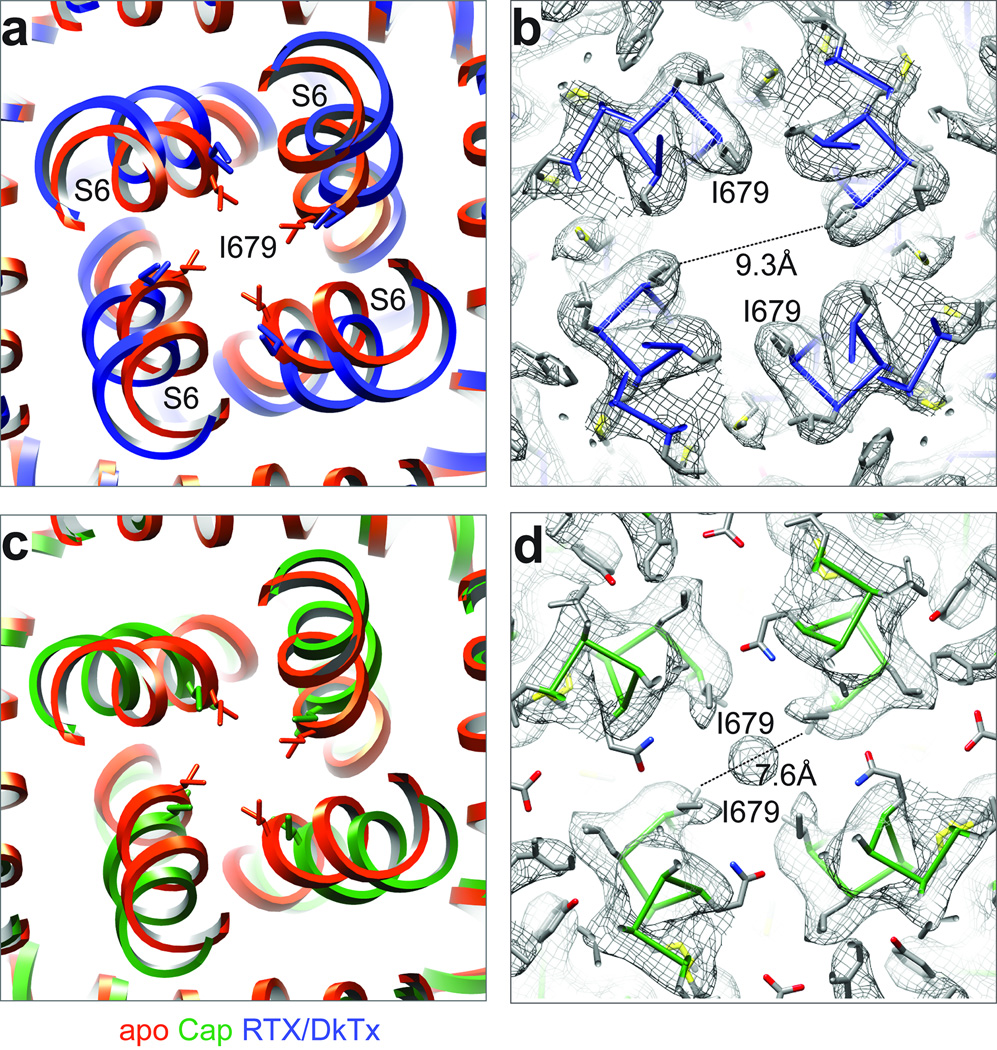
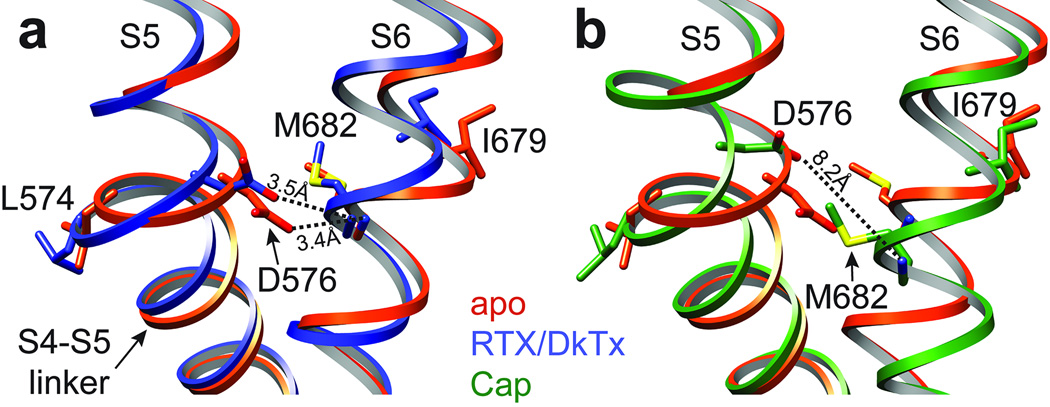
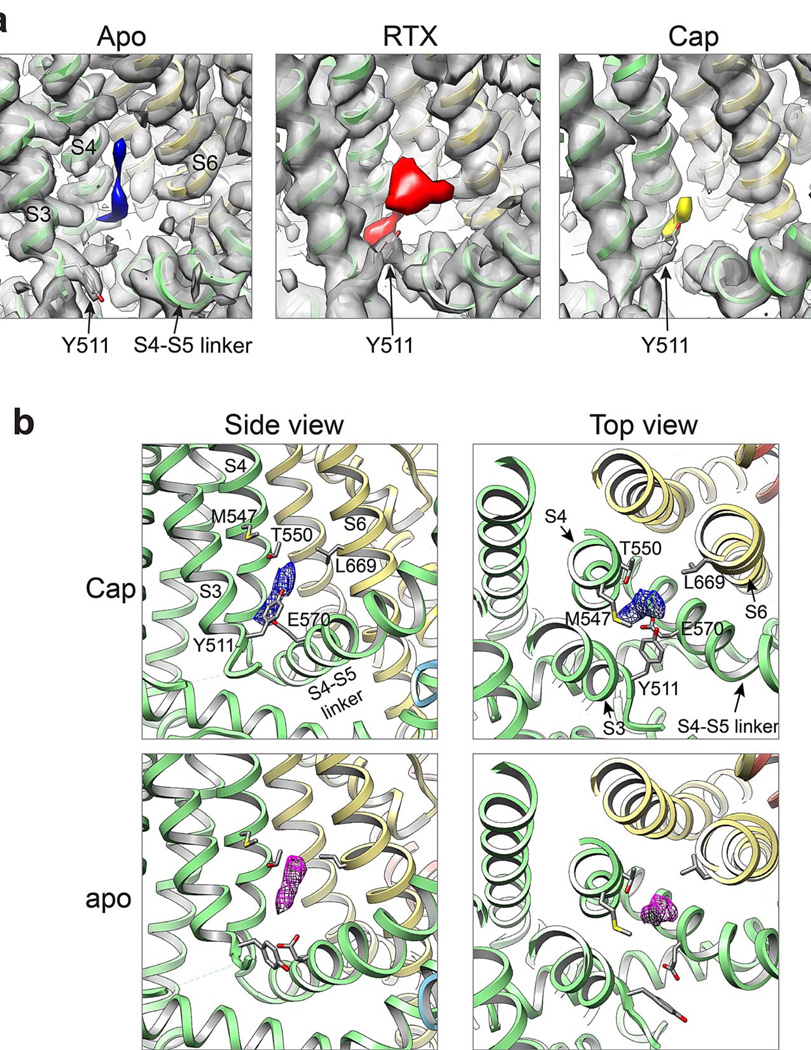
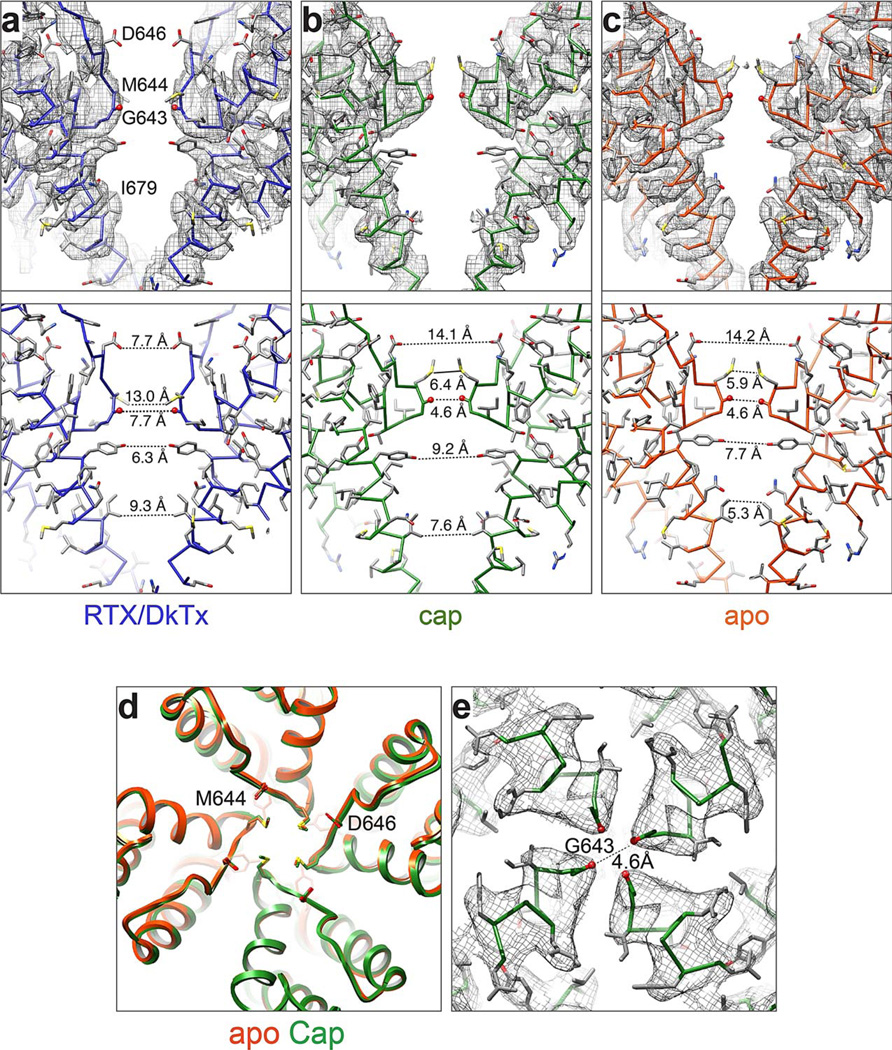
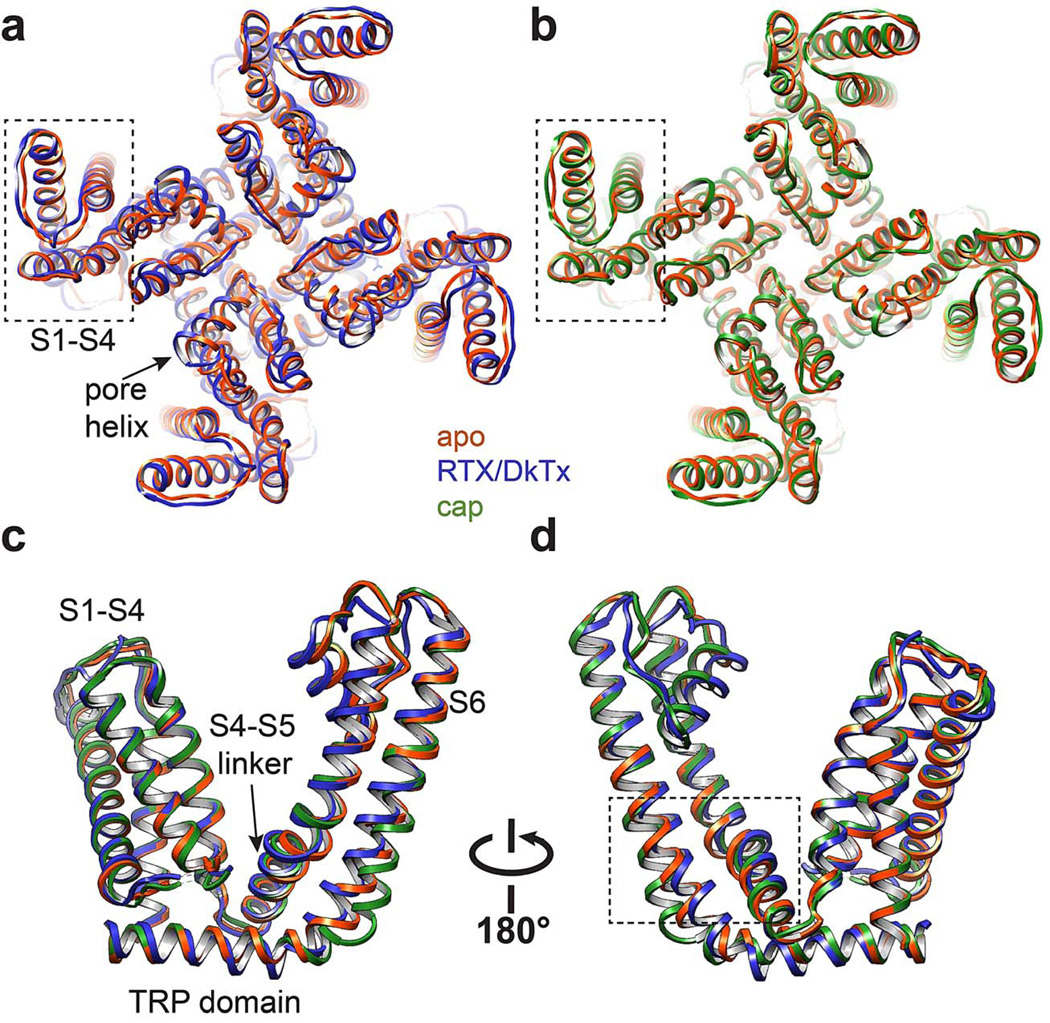
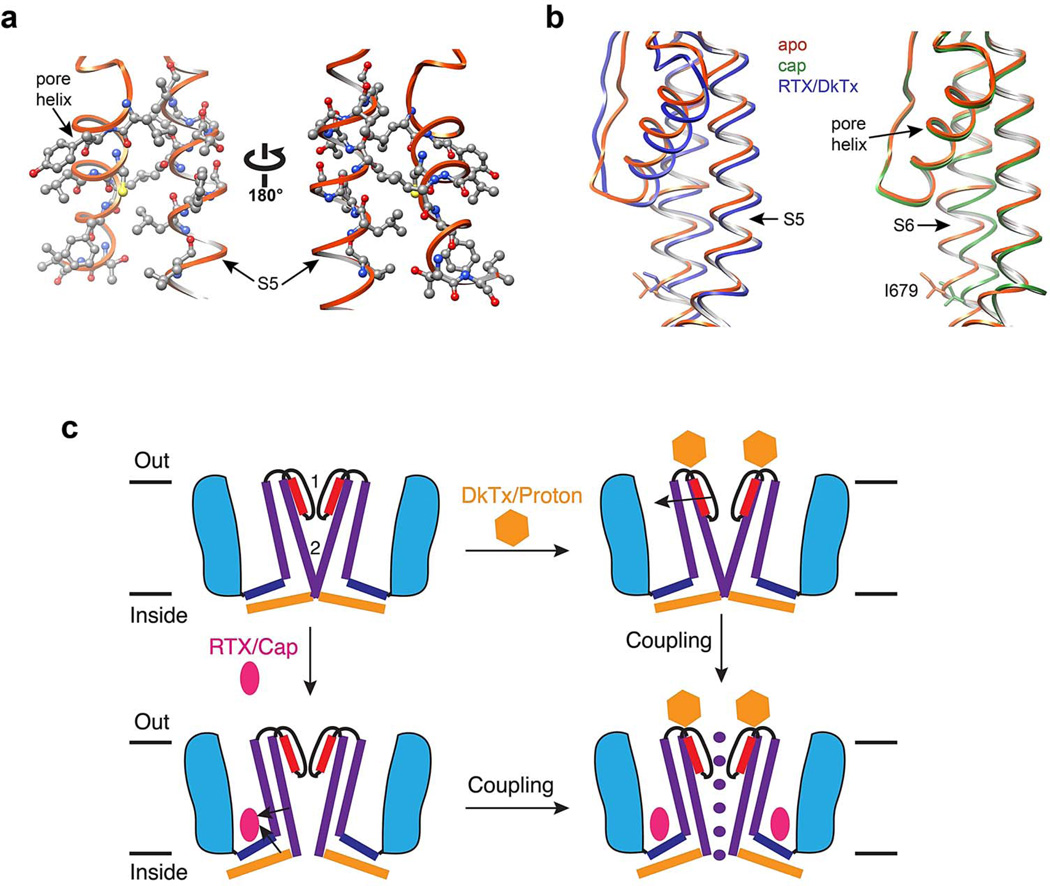
Transient receptor potential (TRP) channels are polymodal signal detectors that respond to a wide range of physical and chemical stimuli. Elucidating how these channels integrate and convert physiological signals into channel opening is essential to understanding how they regulate cell excitability under normal and pathophysiological conditions. Here we exploit pharmacological probes (a peptide toxin and small vanilloid agonists) to determine structures of two activated states of the capsaicin receptor, TRPV1. A domain (consisting of transmembrane segments 1-4) that moves during activation of voltage-gated channels remains stationary in TRPV1, highlighting differences in gating mechanisms for these structurally related channel superfamilies. TRPV1 opening is associated with major structural rearrangements in the outer pore, including the pore helix and selectivity filter, as well as pronounced dilation of a hydrophobic constriction at the lower gate, suggesting a dual gating mechanism. Allosteric coupling between upper and lower gates may account for rich physiological modulation exhibited by TRPV1 and other TRP channels.


Figures

Figure 1
Figure 1. Structure of TRPV1 in complex with vanilloid ligand and spider toxin
a, b, Cryo-EM density map of TRPV1 in complex with vanilloid agonist (resiniferatoxin, RTX; red sphere) and vanillotoxin (DkTx spider toxin; magenta and denoted by arrow) shown as top-down and side views. The map is filtered to 3.8Å and amplified with a temperature factor of −100Å2. c, d, Structures from a and b with TRPV1 channel rendered as ribbon diagram. Density corresponding to each ligand represents signal from difference map (4.7σ) generated by comparison with apo-TRPV1 structure.
Figure 2
Figure 2. Binding sites for spider toxin and vanilloid agonists
a, Detailed views of interaction between TRPV1 subunits (yellow and green) and one ICK knot from DkTx spider toxin (purple). TRPV1 resides in close proximity to the toxin are highlighted, including four (I599, F649, A657, F659) which, when mutated, render the channel specifically insensitive to DkTx. b, Vanilloid binding pocket defined by EM density of RTX (red, filtered at 4.5Å with a temperature factor of −200Å2, 8σ) viewed from the side (left) or top down (i.e. from the extracellular face; right). Residues in close proximity to observed densities are highlighted, including several (Y511, S512, M547, and T550) that have been previously implicated in vanilloid binding.
Figure 3
Figure 3. Comparison of ion permeation pathway in apo- versus liganded channels
a, Superimposition of S5-P-S6 pore module from apo- (orange) versus RTX/DkTx (blue; left) or capsaicin (green; right) bound structures. In each case, only two diagonally opposed subunits are shown for clarity. Key residues in the selectivity filter and lower gate are highlighted to display side chain movements associated with gating. b, Solvent-accessible pathway along the pore mapped using the HOLE program for RTX/DkTx bound, capsaicin bound, and apo TRPV1 structures. Residues located at the selective filter and lower gate are rendered as sticks. c, Comparison of pore radii (calculated with the program HOLE) for RTX/DkTx bound (blue), capsaicin bound (green), and apo (orange) TRPV1 structures.
Figure 4
Figure 4. Structural rearrangements in the outer pore region
a, Superimposed top-down views of outer pore regions from apo- and RTX/DkTx bound TRPV1 structures (orange and blue, respectively). Note shift in relative positions of pore helix and selectivity filter. b, Density map with atomic model showing distance between diagonally opposed G643 residues, which represents the narrowest point in the outer pore region. c, Superimposed side views of the outer pore domains of apo- and RTX/DkTx bound TRPV1 structures (orange and blue, respectively). Residues important for proton-mediated sensitization (E600) or activation (E648) are labeled. Arrow indicates downward rigid body tilt of pore helix in RTX/DkTx structure. d, Proximity of E600 to neighboring residues in the apo structure (left) allows for hydrogen bonding, which is disrupted by rearrangements in the RTX/DkTx bound structure (right).
Figure 5
Figure 5. Opening of the lower gate
a, Superimposition of inner pore region from apo- and RTX/DkTx bound TRPV1 structures (orange and blue, respectively). The residue (I679) that forms the hydrophobic seal of the lower gate is highlighted, and its side chain shown in stick format. b, Density map with atomic model showing distances between I679 in the RTX/DkTx bound channel. Note substantial expansion of the lower gate relative to apo-structure. c, Superimposition of apo- and capsaicin bound TRPV1 inner pore regions (orange and green, respectively). d, Density map with atomic model showing distances between I679 in the capsaicin bound channel. Note expansion of the lower gate relative to apo-structure, but to a lesser extent than seen in RTX/DkTx bound channel. The density at the central cavity may represent noise amplified by applying symmetry, or a trapped hydrated ion. Interestingly, this density is not observed in apo or RTX/DkTx structures.
Figure 6
Figure 6. Coupling of S4-S5 linker and S6 helix
a, b, Superimposition of apo (orange) with RTX/DkTx (blue) or capsaicin (green) bound structures highlighting interactions between residues in the S4-S5 linker and S6 helix. Through these interactions, movement of the S4-S5 linker is translated to rotation or displacement of I679 away from the central axis, breaking the hydrophobic seal to open the lower gate.
Extended Data Figure 1
Extended Data Figure 1. Cryo-EM of TRPV1 in complex with RTX and DkTx
a, b, Fourier transform (a) of a representative image (b). c, 2D class averages of cryo-EM particles. d, Enlarged view of three representative 2D class averages. Arrows indicate DkTx densities near the channel pore. e, Gold-standard FSC curve (red) of the final 3D reconstruction, marked with the resolutions that correspond to FSC = 0.5 and 0.143. The FSC curve between the final map and that calculated from the atomic model is shown in blue. f, Euler angle distribution of all particles used for calculating the final 3D reconstruction. The sizes of balls represent the number of particles. The accuracy of rotation is 5.213°, as reported by RELION.
Extended Data Figure 2
Extended Data Figure 2. 3D reconstruction of TRPV1-ligand complexes filtered at 6Å resolution
a-d, Four different views of the 3D reconstruction low-pass filtered at 6Å and amplified by a temperature factor of −100Å2, fitted with de novo atomic model of TRPV1-RTX/DkTx complex (toxin is shown in magenta and indicated by arrowhead) built as described in Methods. e, f, Two views of the 3D reconstruction displayed at two different isosurface levels (high in yellow and low in gray). At the low isosurface level, the belt-shaped density of amphipols is visible with a thickness of ~30Å. DkTx-related densities are also clearly visible, including the linker peptide that connects the toxin’s two inhibitor cysteine knot (ICK) moieties, as noted.
Extended Data Figure 3
Extended Data Figure 3. Cryo-EM of TRPV1 in complex with capsaicin
a, b, Fourier transform (a) of a representative image (b). c, 2D class averages of cryo-EM particles. d, Enlarged view of three representative 2D class averages. e, Gold-standard FSC curve (red) of the final 3D reconstruction, marked with the resolutions that correspond to FSC = 0.5 and 0.143. The FSC curve between the final map and that calculated from the atomic model is shown in blue. f, Euler angle distribution of all particles used for calculating the final 3D reconstruction. The sizes of balls represent the number of particles. The accuracy of rotation is 4.989°, as reported by RELION.
Extended Data Figure 4
Extended Data Figure 4. 3D reconstruction of TRPV1-capsaicin complex low-pass filtered at 6Å resolution
a-d, Four different views of the 3D reconstruction low-pass filtered at 6Å and amplified by a temperature factor of −100Å2, fitted with de novo atomic model of TRPV1-capsaicin complex built as described in Methods. e, f, Two views of the 3D reconstruction displayed at two different isosurface levels (high in yellow and low in gray). At the low isosurface level, the belt-shaped density of amphipols is visible with a thickness of ~30Å.
Extended Data Figure 5
Extended Data Figure 5. 3D reconstruction of TRPV1-RTX/DkTx complex low-pass filtered at 3.8Å resolution
a-d, Four different views of the 3D reconstruction low pass filtered at 3.8Å with a temperature factor of −100Å2, fitted with de novo atomic model of TRPV1-RTX/DkTx complex (toxin is shown in magenta and indicated by arrows) built as described in Methods.
Extended Data Figure 6
Extended Data Figure 6. 3D reconstruction of TRPV1-capsaicin complex low-pass filtered at 4.2Å resolution
a-d, Four different views of the 3D reconstruction low pass filtered to 4.2Å with a temperature factor of −150Å2, fitted with de novo atomic model of TRPV1-capsaicin complex built as described in Methods.
Extended Data Figure 7
Extended Data Figure 7. Observed densities in vanilloid pocket
a, Non-protein associated densities in the region adjacent to S3-S4 transmembrane helices observed in 3D density maps of apo TRPV1 structure (blue, 3.4Å, −100Å2) or TRPV1 in complex with RTX/DkTx (red, 3.8Å, −150Å2) or capsaicin (yellow, 3.9Å, −150Å2), as indicated. b, Density of bound capsaicin (blue) viewed from the side (left) and top down (i.e. from the extracellular face; right). Density is also observed in the apo-channel structure (purple), possibly representing an endogenous lipid or other small hydrophobic molecule. All maps were low-pass filtered to 4.5Å with a temperature factor of −200Å2, normalized and displayed at the same sigma level (8Å).
Extended Data Figure 8
Extended Data Figure 8. Structural details of the TRPV1 pore with and without ligands
ac Density maps for pore region for two diagonally opposed monomers superimposed onto their atomic models (top). Distances between specific side chain atoms along the pore are also indicated (bottom). d, Superimposed top-down view of apo- and capsaicin bound TRPV1 outer pore regions (orange and green, respectively). e, Density map of selectivity filter in capsaicin-bound TRPV1 structure. The distance between carbonyl oxygens of diagonally opposed G643 residues (4.6Å) does not differ from that of the apo structure (4.6Å).
Extended Data Figure 9
Extended Data Figure 9. S1-S4 as a stationary domain
a, Superimposition of apo- and RTX/DkTx bound TRPV1 structures (orange and blue, respectively) from top-down view. S1-S4 domain (outlined in dashed box) shows near complete overlap. b, Same comparison for apo- and capsaicin bound channel structures (orange and green, respectively). c, d, Superimposition of transmembrane core of apo- versus RTX/DkTx- or capsaicin-bound TRPV1 structures (orange, blue, and green, respectively). Dashed box denotes region highlighted in Figure 6.
Extended Data Figure 10
Extended Data Figure 10. Dual gate model for TRPV1 activation
a, Pore helix and upper half of S5 helix are in close proximity and appear to be physically coupled, representing a potential mechanisms for allosteric coupling between upper and lower gates. Several residues on both helices are rendered as ball-and-stick to highlight close apposition. b, Downward tilt of pore helix away from the central pore is associated with movement of the S5 helix in RTX/DkTx structure (left). This structural arrangement is not observed in capsaicin bound structure (right). c, Model depicting two gate mechanism of TRPV1 activation. Two main constriction points at the selectivity filter (1) and lower gate (2) block ion permeation in the apo, closed state (upper left). Some pharmacological agents (e.g. protons or spider toxins; gold hexagon) target the outer pore region of the channel to open or stabilize the conductive conformation of the selectivity filter (upper right). Arrow denotes proposed coupling between the pore helix and S5. Small vanilloid ligands (e.g. RTX and capsaicin; red ellipse) bind within a hydrophobic pocket formed by the S3-S4 helices, the S4-S5 linker, and the pore module, eliciting conformational changes that expand the lower gate (lower left). Arrows indicate proposed coupling between S4-S5 helix, S6 and TRP domain. Full expansion of the ion permeation pathway and ion conduction is achieved when both upper and lower gates are opened (lower right). Pharmacological and mutagenesis data suggest that these gates are allosterically coupled.

Comment in

Similar articles

Cited by

References

    1. Basbaum AI, Bautista DM, Scherrer G, Julius D. Cellular and molecular mechanisms of pain. Cell. 2009;139:267–284. - PMC - PubMed
    1. Baconguis I, Gouaux E. Structural plasticity and dynamic selectivity of acid-sensing ion channel-spider toxin complexes. Nature. 2012;489:400–405. - PMC - PubMed
    1. Hansen SB, Tao X, MacKinnon R. Structural basis of PIP2 activation of the classical inward rectifier K+ channel Kir2.2. Nature. 2011;477:495–498. - PMC - PubMed
    1. Hattori M, Gouaux E. Molecular mechanism of ATP binding and ion channel activation in P2X receptors. Nature. 2012;485:207–212. - PMC - PubMed
    1. Whorton MR, MacKinnon R. X-ray structure of the mammalian GIRK2-betagamma G-protein complex. Nature. 2013;498:190–197. - PMC - PubMed

Publication types