

iMOSFLM: a new graphical interface for diffraction-image processing with MOSFLM
- PMID: 21460445
- PMCID: PMC3069742
- DOI: 10.1107/S0907444910048675
iMOSFLM: a new graphical interface for diffraction-image processing with MOSFLM
Abstract
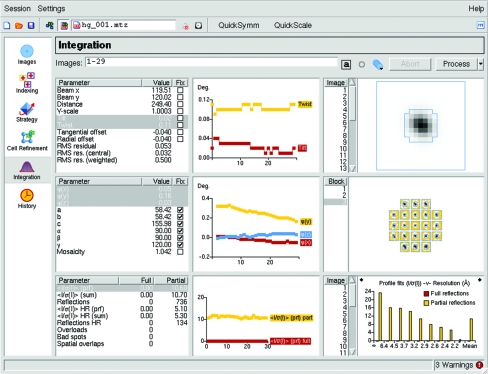
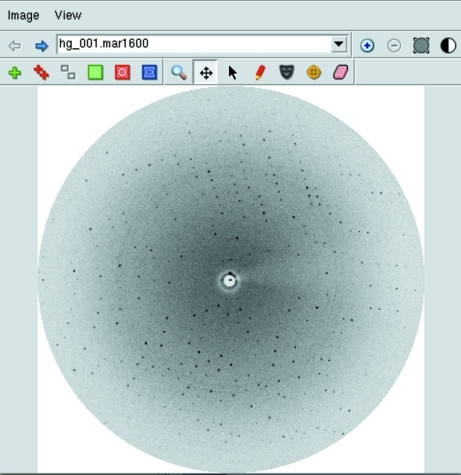
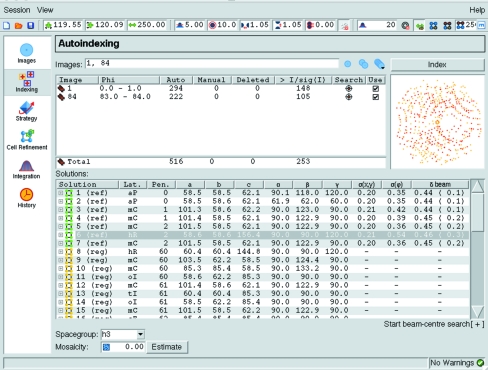
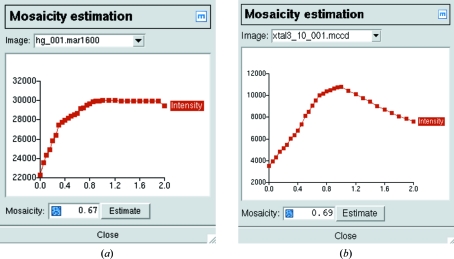
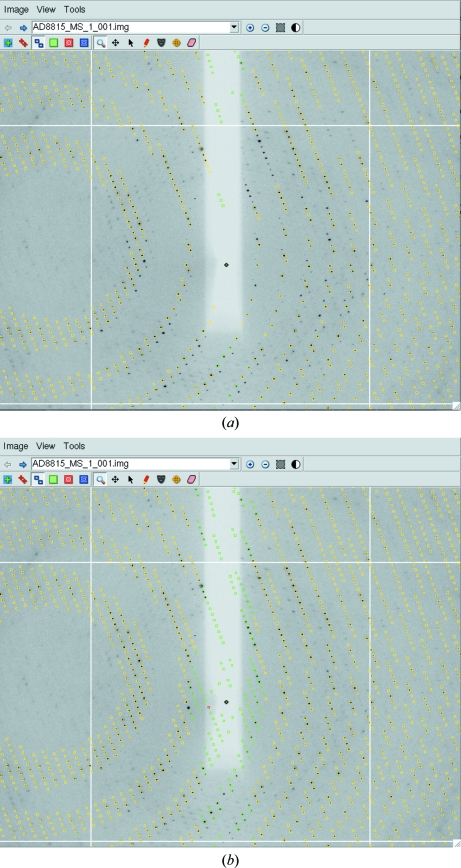
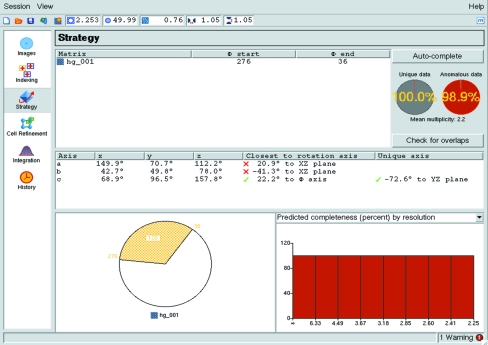
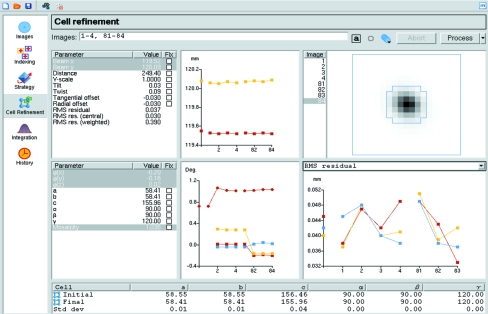
iMOSFLM is a graphical user interface to the diffraction data-integration program MOSFLM. It is designed to simplify data processing by dividing the process into a series of steps, which are normally carried out sequentially. Each step has its own display pane, allowing control over parameters that influence that step and providing graphical feedback to the user. Suitable values for integration parameters are set automatically, but additional menus provide a detailed level of control for experienced users. The image display and the interfaces to the different tasks (indexing, strategy calculation, cell refinement, integration and history) are described. The most important parameters for each step and the best way of assessing success or failure are discussed.
Figures
Similar articles
-
Integrating macromolecular X-ray diffraction data with the graphical user interface iMosflm.Nat Protoc. 2017 Jul;12(7):1310-1325. doi: 10.1038/nprot.2017.037. Epub 2017 Jun 1. Nat Protoc. 2017. PMID: 28569763 Free PMC article.
-
Autoindexing diffraction images with iMosflm.Acta Crystallogr D Biol Crystallogr. 2013 Jul;69(Pt 7):1195-203. doi: 10.1107/S0907444912048524. Epub 2013 Jun 13. Acta Crystallogr D Biol Crystallogr. 2013. PMID: 23793145 Free PMC article.
-
DIALS: implementation and evaluation of a new integration package.Acta Crystallogr D Struct Biol. 2018 Feb 1;74(Pt 2):85-97. doi: 10.1107/S2059798317017235. Epub 2018 Feb 1. Acta Crystallogr D Struct Biol. 2018. PMID: 29533234 Free PMC article.
-
X-ray data processing.Biosci Rep. 2017 Oct 6;37(5):BSR20170227. doi: 10.1042/BSR20170227. Print 2017 Oct 31. Biosci Rep. 2017. PMID: 28899925 Free PMC article. Review.
-
The integration of macromolecular diffraction data.Acta Crystallogr D Biol Crystallogr. 2006 Jan;62(Pt 1):48-57. doi: 10.1107/S0907444905039107. Epub 2005 Dec 14. Acta Crystallogr D Biol Crystallogr. 2006. PMID: 16369093 Review.
Cited by
-
Molecular basis of interchain disulfide-bond formation in BMP-9 and BMP-10.bioRxiv [Preprint]. 2024 Oct 17:2024.10.14.618187. doi: 10.1101/2024.10.14.618187. bioRxiv. 2024. Update in: J Mol Biol. 2025 Jan 8;437(4):168935. doi: 10.1016/j.jmb.2025.168935. PMID: 39464140 Free PMC article. Updated. Preprint.
-
Insights into Acinetobacter baumannii fatty acid synthesis 3-oxoacyl-ACP reductases.Sci Rep. 2021 Mar 29;11(1):7050. doi: 10.1038/s41598-021-86400-1. Sci Rep. 2021. PMID: 33782435 Free PMC article.
-
Crystallization and preliminary X-ray diffraction analysis of the invertase from Saccharomyces cerevisiae.Acta Crystallogr Sect F Struct Biol Cryst Commun. 2012 Dec 1;68(Pt 12):1538-41. doi: 10.1107/S1744309112044417. Epub 2012 Nov 19. Acta Crystallogr Sect F Struct Biol Cryst Commun. 2012. PMID: 23192042 Free PMC article.
-
Structural basis of direct and inverted DNA sequence repeat recognition by helix-turn-helix transcription factors.Nucleic Acids Res. 2022 Nov 11;50(20):11938-11947. doi: 10.1093/nar/gkac1024. Nucleic Acids Res. 2022. PMID: 36370103 Free PMC article.
-
MinD-like ATPase FlhG effects location and number of bacterial flagella during C-ring assembly.Proc Natl Acad Sci U S A. 2015 Mar 10;112(10):3092-7. doi: 10.1073/pnas.1419388112. Epub 2015 Mar 2. Proc Natl Acad Sci U S A. 2015. PMID: 25733861 Free PMC article.
References
-
- Arndt, U. W. & Wonacott, A. J. (1977). Editors. The Rotation Method in Crystallography Amsterdam: North-Holland.
-
- Briggs, P. & Cowtan, K. (2007). CCP4 Newsl. 47, contribution 7.
-
- Campbell, J. W. (1995). J. Appl. Cryst. 28, 236–242.
-
- Evans, P. (2006). Acta Cryst. D62, 72–82. - PubMed
Publication types
MeSH terms
Grants and funding
LinkOut - more resources
Full Text Sources
Other Literature Sources
