Comparative Study
. 2009 Jun;65(Pt 6):582-601.
doi: 10.1107/S0907444909012098. Epub 2009 May 15.

Decision-making in structure solution using Bayesian estimates of map quality: the PHENIX AutoSol wizard

Affiliations
Comparative Study

Decision-making in structure solution using Bayesian estimates of map quality: the PHENIX AutoSol wizard

Thomas C Terwilliger et al. Acta Crystallogr D Biol Crystallogr. 2009 Jun.

Abstract

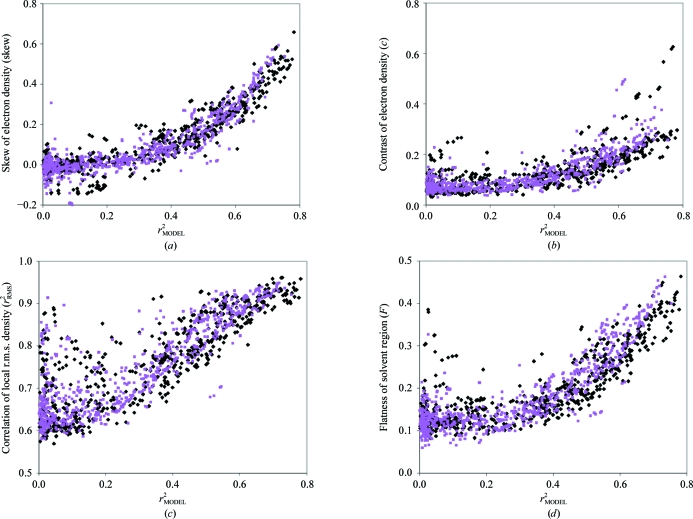
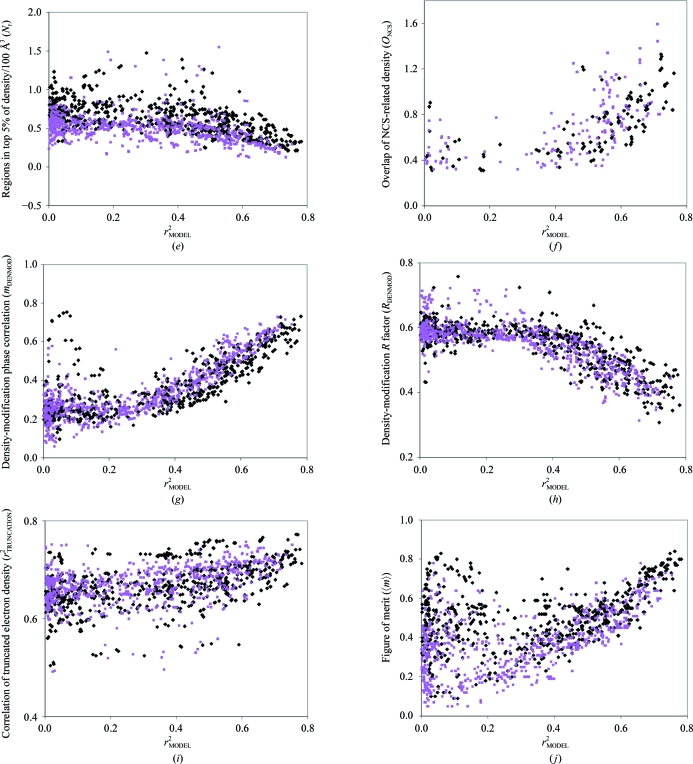
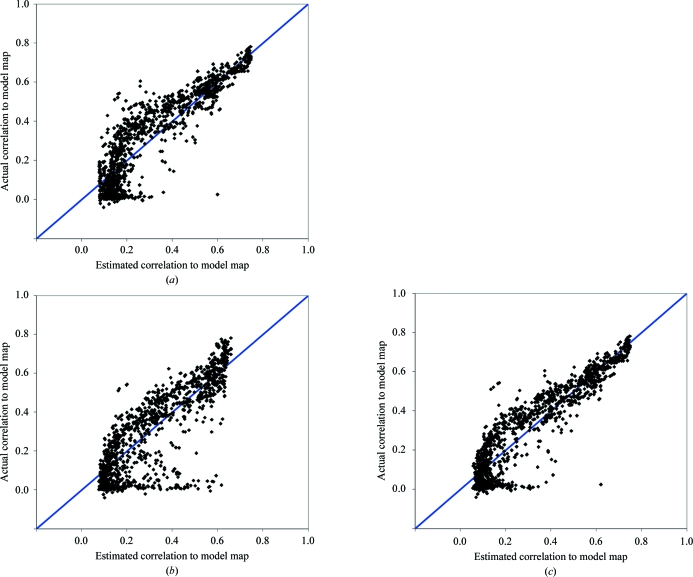
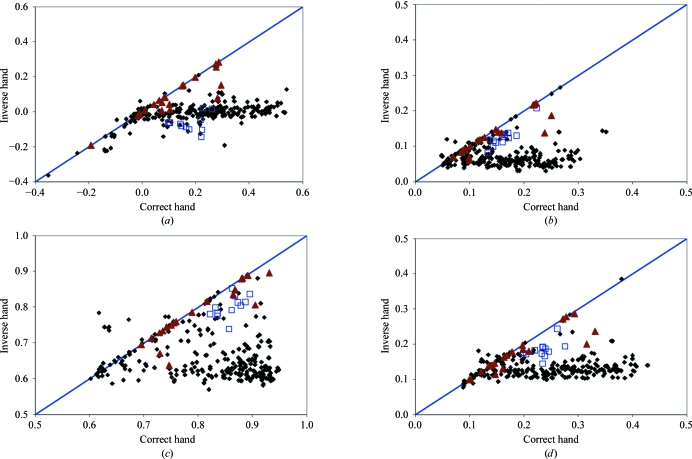
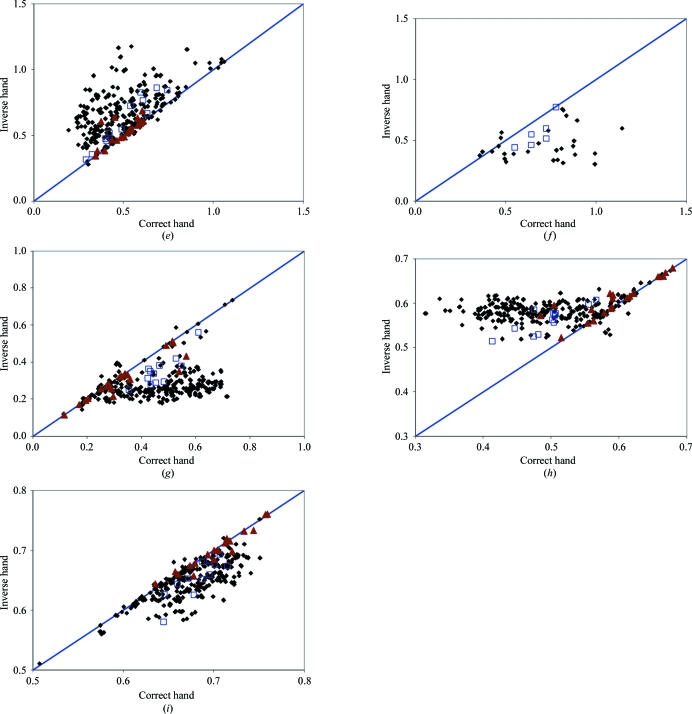
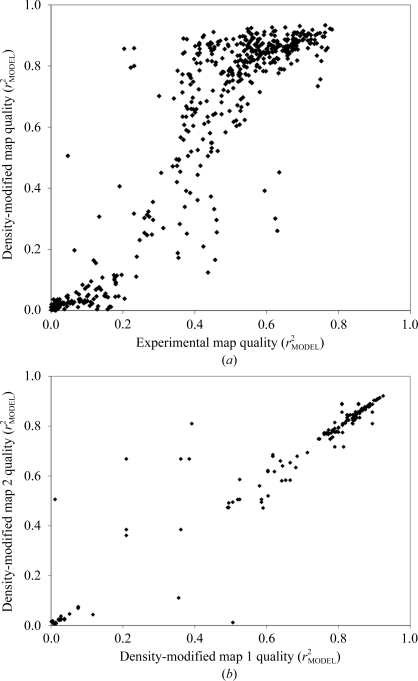
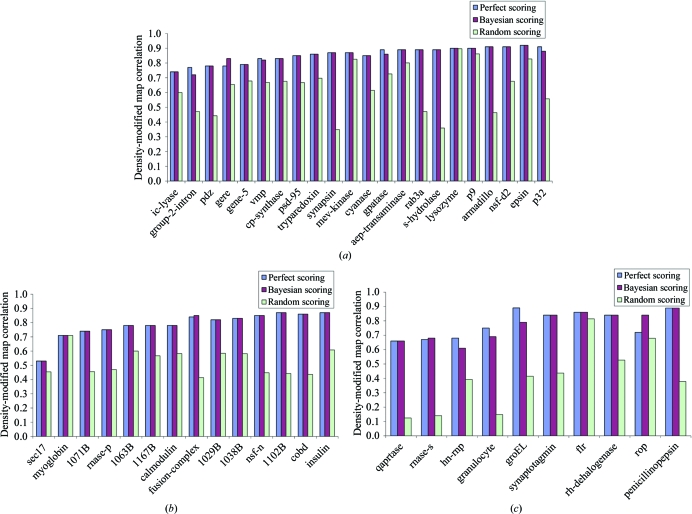
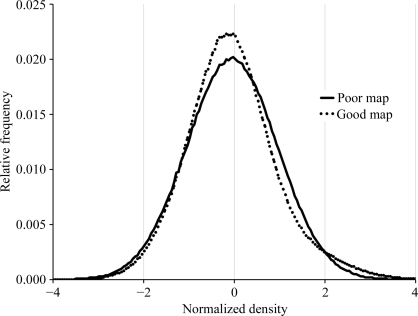
Estimates of the quality of experimental maps are important in many stages of structure determination of macromolecules. Map quality is defined here as the correlation between a map and the corresponding map obtained using phases from the final refined model. Here, ten different measures of experimental map quality were examined using a set of 1359 maps calculated by re-analysis of 246 solved MAD, SAD and MIR data sets. A simple Bayesian approach to estimation of map quality from one or more measures is presented. It was found that a Bayesian estimator based on the skewness of the density values in an electron-density map is the most accurate of the ten individual Bayesian estimators of map quality examined, with a correlation between estimated and actual map quality of 0.90. A combination of the skewness of electron density with the local correlation of r.m.s. density gives a further improvement in estimating map quality, with an overall correlation coefficient of 0.92. The PHENIX AutoSol wizard carries out automated structure solution based on any combination of SAD, MAD, SIR or MIR data sets. The wizard is based on tools from the PHENIX package and uses the Bayesian estimates of map quality described here to choose the highest quality solutions after experimental phasing.


Figures

Figure 1
Figure 1
Measures of the quality of electron-density maps and structure factors. Measures of quality were calculated as described in the text for 1359 sets of structure factors and associated maps. Each measure is plotted with an abscissa equal to the correlation of density of the map with a map calculated from a final model (r 2 MODEL). Measures based on structures determined at resolutions of 2 Å or higher are shown as black diamonds and those at resolutions lower than 2 Å are shown as purple squares. All measures of quality and the correlation with model density (r 2 MODEL) were calculated at a resolution of 2.5 Å or the nominal resolution of the data, whichever is the lower. (a) Skewness of electron density. (b) Contrast of electron density. (c) Correlation of local r.m.s. density. (d) Flatness of solvent region. (e) Number of regions enclosing high density. (f) Overlap of NCS-related density. (g) Phase correlation from statistical density modification. (h) R factor from statistical density modification. (i) Density truncation. (j) Figure of merit of phasing.
Figure 1
Figure 1
Measures of the quality of electron-density maps and structure factors. Measures of quality were calculated as described in the text for 1359 sets of structure factors and associated maps. Each measure is plotted with an abscissa equal to the correlation of density of the map with a map calculated from a final model (r 2 MODEL). Measures based on structures determined at resolutions of 2 Å or higher are shown as black diamonds and those at resolutions lower than 2 Å are shown as purple squares. All measures of quality and the correlation with model density (r 2 MODEL) were calculated at a resolution of 2.5 Å or the nominal resolution of the data, whichever is the lower. (a) Skewness of electron density. (b) Contrast of electron density. (c) Correlation of local r.m.s. density. (d) Flatness of solvent region. (e) Number of regions enclosing high density. (f) Overlap of NCS-related density. (g) Phase correlation from statistical density modification. (h) R factor from statistical density modification. (i) Density truncation. (j) Figure of merit of phasing.
Figure 2
Figure 2
Comparisons of cross-validated estimates of map quality with actual map quality. Measures of map quality as shown in Fig. 1 ▶ were used in (7a) and (8a) to estimate overall map quality. The calculations were carried out one data set at a time. For each data set, joint probability distributions of each measure of quality and true quality [e.g. p(skew, r 2 MODEL)] were calculated excluding data from all solutions for that structure. These cross-validated joint probability distributions were used in (7a) and (8a) to estimate map quality using the measures of quality for each map associated with that data set. In each case, the true map quality (r 2 MODEL) is plotted as a function of the Bayesian estimates of map quality. (a) Estimates of map quality using the skewness of electron density in (7a). (b) Estimates using the correlation of local r.m.s. density in (7a). (c) Estimates using the skewness and correlation of local r.m.s. density in (8a).
Figure 3
Figure 3
Comparisons of measures of map quality for pairs of maps based on enantiomorphic heavy-atom substructures. For structures in nonchiral space groups, all pairs of solutions derived from enantiomorphic pairs of heavy-atom substructures were selected. The member of the pair leading to the map with the higher correlation coefficient to the corresponding model map was identified as the ‘correct’ hand and the other as the ‘inverse’ hand. The value of each measure of map quality for the correct hand is plotted as the abscissa in each plot and the value of the measure for the corresponding inverse hand is the ordinate. Maps based on MAD data are represented as black diamonds, those from MIR data (all maps examined in this figure are from single derivatives) are represented as red triangles and those from SAD data are represented as blue squares. (a) Skewness of electron density. (b) Contrast of electron density. (c) Correlation of local r.m.s. density. (d) Flatness of solvent region. (e) Number of regions enclosing high density. (f) Overlap of NCS-related density. (g) Phase correlation from statistical density modification. (h) R factor from statistical density modification. (i) Density truncation.
Figure 3
Figure 3
Comparisons of measures of map quality for pairs of maps based on enantiomorphic heavy-atom substructures. For structures in nonchiral space groups, all pairs of solutions derived from enantiomorphic pairs of heavy-atom substructures were selected. The member of the pair leading to the map with the higher correlation coefficient to the corresponding model map was identified as the ‘correct’ hand and the other as the ‘inverse’ hand. The value of each measure of map quality for the correct hand is plotted as the abscissa in each plot and the value of the measure for the corresponding inverse hand is the ordinate. Maps based on MAD data are represented as black diamonds, those from MIR data (all maps examined in this figure are from single derivatives) are represented as red triangles and those from SAD data are represented as blue squares. (a) Skewness of electron density. (b) Contrast of electron density. (c) Correlation of local r.m.s. density. (d) Flatness of solvent region. (e) Number of regions enclosing high density. (f) Overlap of NCS-related density. (g) Phase correlation from statistical density modification. (h) R factor from statistical density modification. (i) Density truncation.
Figure 4
Figure 4
Map qualities of density-modified maps. (a) Qualities of density-modified maps as a function of the qualities of the corresponding experimental maps. (b) Comparison of qualities of pairs of density-modified maps for the same structure derived from experimental maps of similar quality (see text).
Figure 5
Figure 5
Comparison of quality of density-modified maps obtained using the skewness of electron density and correlation of local r.m.s. density for scoring with those obtained using the true map quality (correlation to the corresponding model map) for scoring. See text for details. The light blue bars labeled ‘Perfect scoring’ correspond to running the PHENIX AutoSol wizard and using the actual experimental map quality to make decisions at each step prior to obtaining density-modified phases and using the actual density-modified map quality to make the final choice of solution. The dark maroon bars labeled ‘Bayesian scoring’ correspond to using the Bayesian scores for experimental maps based on the skewness of electron density and correlation of local r.m.s. density and using the model–map correlation to choose the final density-modified solution. The light green bars labeled ‘Random scoring’ correspond to using random scores to make decisions about experimental map quality and model–map correlation to choose the final solution. Each ‘random scoring’ value is the average of ten separate runs of PHENIX AutoSol wizard carried out with differing random seeds. Note that the ‘perfect scoring’ method does not necessarily lead to the best final map. For example, an experimental map that is not the best one but is chosen by another scoring method could adventitiously yield additional sites that lead to a better final solution. (a) Structures determined using MAD. Structures shown are aep-transaminase (PDB code 1m32; Chen et al., 2002 ▶), armadillo (3bct; Huber et al., 1997 ▶), cobd (1kus; Cheong et al., 2002 ▶), cp-synthase (1l1e; Huang et al., 2002 ▶), cyanase (1dw9; Walsh et al., 2000 ▶), epsin (1edu; Hyman et al., 2000 ▶), gene-5 (1vqb; Skinner et al., 1994 ▶), gere (1fse; Ducros et al., 2001 ▶), gpatase (1ecf; Muchmore et al., 1998 ▶), group2-intron (1kxk; Zhang & Doudna, 2002 ▶), ic-lyase (1f61; Sharma et al., 2000 ▶), lysozyme (unpublished results; CSHL Macromolecular Crystallography Course), mbp (1ytt; Burling et al., 1996 ▶), mev-kinase (1kkh; Yang et al., 2002 ▶), nsf-d2 (1nsf; Yu et al., 1998 ▶), p32 (1p32; Jiang et al., 1999 ▶), p9 (1bkb; Peat et al., 1998 ▶), pdz (1kwa; Daniels et al., 1998 ▶), psd-95 (1jxm; Tavares et al., 2001 ▶), rab3a (1zbd; Ostermeier & Brunger, 1999 ▶), s-hydrolase (1a7a; Turner et al., 1998 ▶), synapsin (1auv; Esser et al., 1998 ▶), tryparedoxin (1qk8; Alphey et al., 1999 ▶) and vmp (1l8w; Eicken et al., 2002 ▶) (b) Structures determined using SAD: 1029B (1n0e; Chen et al., 2004 ▶), 1038B (1lql; Choi et al., 2003 ▶), 1063B (1lfp; Shin et al., 2002 ▶), 1071B (1nf2; Shin, Roberts et al., 2003 ▶), 1102B (1l2f; Shin, Nguyen et al., 2003 ▶), 1167B (1s12; Shin et al., 2005 ▶), rnase-p (1nz0; Kazantsev et al., 2003 ▶), calmodulin (1exr; Wilson & Brunger, 2000 ▶), fusion-complex (1sfc; Sutton et al., 1998 ▶), insulin (2bn3; Nanao et al., 2005 ▶), myoglobin (A. Gonzales, personal communication), nsf-n (1qcs; Yu et al., 1999 ▶), sec17 (1qqe; Rice & Brunger, 1999 ▶) and ut-synthase (1e8c; Gordon et al., 2001 ▶). Note that fusion-complex was solved with SAD plus SIR. (c) Structures determined using MIR: flr (1bkj; Tanner et al., 1996 ▶), granulocyte (2gmf; Rozwarski et al., 1996 ▶), groEL (1oel; Braig et al., 1995 ▶), hn-rnp (1ha1; Shamoo et al., 1997 ▶), penicillopepsin (3app; James & Sielecki, 1983 ▶), qaprtase (1qpo; Sharma et al., 1998 ▶), rh-dehalogenase (1bn7; Newman et al., 1999 ▶), rnase-s (1rge; Sevcik et al., 1996 ▶), rop (1f4n; Willis et al., 2000 ▶) and synaptotagmin (1dqv; Sutton et al., 1999 ▶).
Figure 6
Figure 6
Histograms of density corresponding to a poor map (dotted lines, correlation to model map of 0.04) and to a good map (solid lines, correlation to model map of 0.66). See text for details.

Similar articles

Cited by

References

    1. Adams, P. D., Grosse-Kunstleve, R. W., Hung, L.-W., Ioerger, T. R., McCoy, A. J., Moriarty, N. W., Read, R. J., Sacchettini, J. C., Sauter, N. K. & Terwilliger, T. C. (2002). Acta Cryst. D58, 1948–1954. - PubMed
    1. Alphey, M. S., Leonard, G. A., Gourley, D. G., Tetaud, E., Fairlamb, A. H. & Hunter, W. N. (1999). J. Biol. Chem.274, 25613–25622. - PubMed
    1. Baker, D., Bystroff, C., Fletterick, R. J. & Agard, D. A. (1993). Acta Cryst. D49, 429–439. - PubMed
    1. Berman, H. M., Westbrook, J., Feng, Z., Gilliland, G., Bhat, T. N., Weissig, I. N., Shindyalov, I. N. & Bourne, P. E. (2000). Nucleic Acids Res.28, 235–242. - PMC - PubMed
    1. Bernstein, F. C., Koetzle, T. F., Williams, G. J. B., Meyer, E. F. Jr, Brice, M. D., Rodgers, J. R., Kennard, O., Shimanouchi, T. & Tasumi, M. (1977). J. Mol. Biol.112, 535–542. - PubMed

Publication types

Substances