. 2009 Aug;58(8):1091-103.
doi: 10.1136/gut.2008.165886. Epub 2009 Feb 24.

Changes in gut microbiota control inflammation in obese mice through a mechanism involving GLP-2-driven improvement of gut permeability

Affiliations

Changes in gut microbiota control inflammation in obese mice through a mechanism involving GLP-2-driven improvement of gut permeability

P D Cani et al. Gut. 2009 Aug.

Abstract

Background and aims: Obese and diabetic mice display enhanced intestinal permeability and metabolic endotoxaemia that participate in the occurrence of metabolic disorders. Our recent data support the idea that a selective increase of Bifidobacterium spp. reduces the impact of high-fat diet-induced metabolic endotoxaemia and inflammatory disorders. Here, we hypothesised that prebiotic modulation of gut microbiota lowers intestinal permeability, by a mechanism involving glucagon-like peptide-2 (GLP-2) thereby improving inflammation and metabolic disorders during obesity and diabetes.

Methods: Study 1: ob/ob mice (Ob-CT) were treated with either prebiotic (Ob-Pre) or non-prebiotic carbohydrates as control (Ob-Cell). Study 2: Ob-CT and Ob-Pre mice were treated with GLP-2 antagonist or saline. Study 3: Ob-CT mice were treated with a GLP-2 agonist or saline. We assessed changes in the gut microbiota, intestinal permeability, gut peptides, intestinal epithelial tight-junction proteins ZO-1 and occludin (qPCR and immunohistochemistry), hepatic and systemic inflammation.

Results: Prebiotic-treated mice exhibited a lower plasma lipopolysaccharide (LPS) and cytokines, and a decreased hepatic expression of inflammatory and oxidative stress markers. This decreased inflammatory tone was associated with a lower intestinal permeability and improved tight-junction integrity compared to controls. Prebiotic increased the endogenous intestinotrophic proglucagon-derived peptide (GLP-2) production whereas the GLP-2 antagonist abolished most of the prebiotic effects. Finally, pharmacological GLP-2 treatment decreased gut permeability, systemic and hepatic inflammatory phenotype associated with obesity to a similar extent as that observed following prebiotic-induced changes in gut microbiota.

Conclusion: We found that a selective gut microbiota change controls and increases endogenous GLP-2 production, and consequently improves gut barrier functions by a GLP-2-dependent mechanism, contributing to the improvement of gut barrier functions during obesity and diabetes.


Conflict of interest statement

Competing interests: None.

Figures

Figure 1
Figure 1
Prebiotic-associated changes in the gut microbiota. DGGE fingerprint patterns of the caecal microbial community of selected ob/ob mice fed a normal-diet (Ob-CT, white symbols), non-prebiotic control diet (Ob-Cell, grey symbols) or prebiotic diet (Ob-Pre, black symbols) for 5 weeks. The DGGE profiles were constructed using primers for (A) Total bacteria (B) Bifidobacterium spp (C) Lactobacillus spp. Cluster analysis is based on the Pearson product–moment correlation coefficient and UPGMA linkage. (D) Three-dimensional multidimensional scaling analysis conducted on the DGGE fingerprinting composite data set (total bacteria, Bifidobacterium spp. and Lactobacillus spp). CT, Cell and Pre respectively refer to the selected ob/ob mice fed a normal-diet, non-prebiotic control diet or prebiotic diet for 5 weeks. DGGE, denaturing gradient gel electrophoresis; UPGMA, unweighted pair group method with arithmetic mean clustering algorithm.
Figure 2
Figure 2
Prebiotic treatment reduces intestinal permeability. (A) Intestinal permeability assay: Plasma DX-4000–FITC (μg/ml) oral challenge measured in ob/ob mice fed a normal diet (Ob-CT), non-prebiotic control diet (Ob-Cell), prebiotic diet (Ob-Pre) for 5 weeks. The inset corresponds to the area under curve (AUC) in the same groups. (B) Plasma endotoxin (LPS) concentrations (EU/ml); the inset corresponds to correlation between plasma LPS levels and plasma DX-4000–FITC (Pearson’s r correlation and corresponding p value). (C,F) Jejunum epithelial tight-junction protein markers (ZO-1 and occludin mRNA concentrations) relative expression to Ob-CT. Data are mean with the SEM. Data with different superscript letters are significantly different (p<0.05), according to the post hoc ANOVA statistical analysis. (D,G) Correlations between intestinal permeability markers: plasma DX-4000–FITC and ZO-1 and occludin mRNA concentrations (p<0.05); the inset corresponds to Pearson’s r correlation and corresponding p value. (E,H) Immunohistochemistry score of the jejunum epithelial tight-junction proteins (ZO-1 and occludin) in wild-type (CT), Ob-CT, Ob-Cell or Ob-Pre mice. DX-4000, dextran of molecular weight 4000 Da; EU, endotoxin unit; FITC, fluroescein isothiocyanate; LPS, lipopolysaccharide.
Figure 3
Figure 3
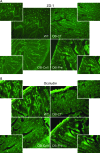
Prebiotic treatment changes tight-junction proteins distribution. Representative immunofluorescence staining for (A) ZO-1 and (B) occludin in ob/ob mice fed a normal diet (Ob-CT), non-prebiotic control diet (Ob-Cell), prebiotic diet (Ob-Pre) for 5 weeks. WT, wild-type.
Figure 4
Figure 4
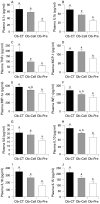
Prebiotic treatment reduces the occurrence of systemic inflammation. (A) IL1α, (B) IL1b, (C) TNFα, (D) MCP-1, (E) MIP-1a, (F) INFγ, (G) IL6, (H) IL10, (I) IL18 and (J) IL15 plasma levels (pg/ml) in ob/ob mice fed a normal diet (Ob-CT), non-prebiotic control diet (Ob-Cell) or prebiotic diet (Ob-Pre) for 5 weeks. Data are mean with the SEM. Data with different superscript letters are significantly different (p<0.05), according to the post hoc ANOVA statistical analysis. IFN, interferon; IL, interleukin; MCP-1, monocyte chemoattratant protein-1; MIP-1a, macrophage inflammatory protein-1a; TNF, tumour necrosis factor.
Figure 5
Figure 5
Changes in the gut microbiota control hepatic inflammation, oxidative stress and macrophage infiltration markers. (A,I) Inflammation: PAI-1, TNFα mRNA concentrations; (B,J) Macrophage infiltration markers: CD68, TLR4 mRNA concentrations; (E,F) Oxidative stress markers: NADPHox, iNOS mRNA concentrations in ob/ob mice fed a normal diet (Ob-CT), non-prebiotic control diet (Ob-Cell) or prebiotic diet (Ob-Pre) for 5 weeks. Data are mean with the SEM. Data with different superscript letters are significantly different (p<0.05), according to the post hoc ANOVA statistical analysis. Correlations between liver NADPHox mRNA and (C) liver CD68 mRNA, (D) TLR4 mRNA or (K) plasma MCP-1 levels. Correlations between plasma MCP-1 and (H) liver CD68 mRNA or (L) TLR4 mRNA. (G) Correlation between liver CD68 mRNA and TLR4 mRNA concentrations (p<0.05) the inset corresponds to Pearson’s r correlation and corresponding p value. iNOS, inducible nitric oxide synthase; MCP-1, monocyte chemoattractant protein-1; NADPHox, NADPH oxidase; PAI-1, plasminogen activator inhibitor; TLR, toll-like receptor; TNF, tumour necrosis factor.
Figure 6
Figure 6
Prebiotic administration increases intestinal proglucagon mRNA and correlates with intestinal permeability markers. (A) Jejunum proglucagon mRNA concentrations; (B) proximal colon proglucagon mRNA concentrations in ob/ob mice fed a normal diet (Ob-CT), non-prebiotic control diet (Ob-Cell), prebiotic diet (Ob-Pre) for 5 weeks. Data are mean with the SEM. Data with different superscript letters are significantly different (p<0.05), according to the post hoc ANOVA statistical analysis. Correlations between plasma GLP-2 levels and (C) plasma LPS plasma; or (D) DX-4000–FITC plasma levels. Correlations between proglucagon mRNA and (E) jejunum ZO-1 or (F) occludin mRNA concentrations; the inset corresponds to Pearson’s r correlation and corresponding p value. DX 4000, dextran of molecular weight 4000 Da; FITC, fluorescein isothiocyanate; GLP-2, glucogon-like protein-2; LPS, lipopolysaccharide.
Figure 7
Figure 7
Chronic GLP-2 antagonist treatment blunts prebiotic-induced reduction in endotoxaemia and hepatic inflammatory tone. (A) Plasma LPS concentrations (EU/ml); (B,D) Macrophage infiltration markers: TLR4, CD68mRNA concentrations; (C,E) oxidative stress markers: NADPHox, iNOS mRNA concentrations; (F,G) hepatic inflammation: PAI-1, TNFα mRNA concentrations; (H) jejunum epithelial tight-junction protein markers (ZO-1 and occludin mRNA) concentrations; (I) jejunum proglucagon mRNA concentrations in ob/ob mice fed a normal diet and injected twice daily with a saline (Ob-CT), prebiotic diet and injected twice daily with a saline (Ob-Pre), prebiotic diet and injected twice daily with GLP-2 antagonist (ObPre-Ant), normal diet and injected twice daily with GLP-2 antagonist (Ob-Ant) for 4 weeks. Data are mean with the SEM. *Significantly different (p<0.05) from Ob-CT and Ob-Pre-Ant according to the Kruskal–Wallis test analysis. Data with different superscript letters are significantly different (p<0.05), according to the post hoc ANOVA statistical analysis. EU, endotoxin unit; GLP-2, glucagon-like protein-2; iNOS, inducible nitric oxide synthase; NADPHox, NADPH oxidase; PAI-1, plasminogen activator inhibitor-1; PG, proglucagon; TJ, tight junction; TLR, toll-like receptor; TNF, tumour necrosis factor.
Figure 8
Figure 8
Chronic GLP-2 treatment lowers endotoxaemia, improves gut permeability markers, and reduces systemic and hepatic inflammation, oxidative stress and macrophage infiltration markers. (A) Plasma LPS concentrations (EU/ml); Cytokines and chemokines plasma levels (pg/ml): (B) IL1α; (C) IL10; (D) MIP-1a; (E) MCP-1; (F,J) hepatic inflammation: TNFα, PAI-1 mRNA concentrations; (G,I) macrophage infiltration markers: TLR4, CD68mRNA concentrations; (H,K) oxidative stress markers: iNOS, NADPHox mRNA; (L) immunohistochemistry score and (M) representative immunofluorescence staining of the jejunum epithelial tight-junction proteins (ZO-1 and occludin) measured in ob/ob mice injected twice daily with a saline vehicle (Ob-CT) or GLP-2 (Ob-GLP-2) for 12 days. Data are mean with the SEM. *Significantly different (p<0.05) from Ob-CT mice according to the two-tailed Student t test. EU, endotoxin unit; GLP-2, glucogon-like protein-2; iNOS, inducible nitric oxide synthase; IL, interleukin; LPS, lipopolysaccharide; MCP-1, monocyte chemoattractant protein-1; MIP-1a, macrophage inflammatory protein-1a; NADPHox, NADPH oxidase; TLR, toll-like receptor; TNF, tumour necrosis factor.

Comment in

Similar articles

Cited by

References

    1. Alberti KG, Zimmet P, Shaw J. The metabolic syndrome – a new worldwide definition. Lancet 2005;366:1059–62 - PubMed
    1. Matarese G, Mantzoros C, La CA. Leptin and adipocytokines: bridging the gap between immunity and atherosclerosis. Curr Pharm Des 2007;13:3676–80 - PubMed
    1. Backhed F, Manchester JK, Semenkovich CF, et al. Mechanisms underlying the resistance to diet-induced obesity in germ-free mice. Proc Natl Acad Sci U S A 2007;104:979–84 - PMC - PubMed
    1. Ley RE, Backhed F, Turnbaugh P, et al. Obesity alters gut microbial ecology. Proc Natl Acad Sci U S A 2005;102:11070–5 - PMC - PubMed
    1. Backhed F, Ding H, Wang T, et al. The gut microbiota as an environmental factor that regulates fat storage. Proc Natl Acad Sci U S A 2004;101:15718–23 - PMC - PubMed

Publication types

MeSH terms