. 2007 Jun;27(11):4142-56.
doi: 10.1128/MCB.01932-06. Epub 2007 Mar 19.

Increased activity of hypoxia-inducible factor 1 is associated with early embryonic lethality in Commd1 null mice

Affiliations

Increased activity of hypoxia-inducible factor 1 is associated with early embryonic lethality in Commd1 null mice

Bart van de Sluis et al. Mol Cell Biol. 2007 Jun.

Abstract

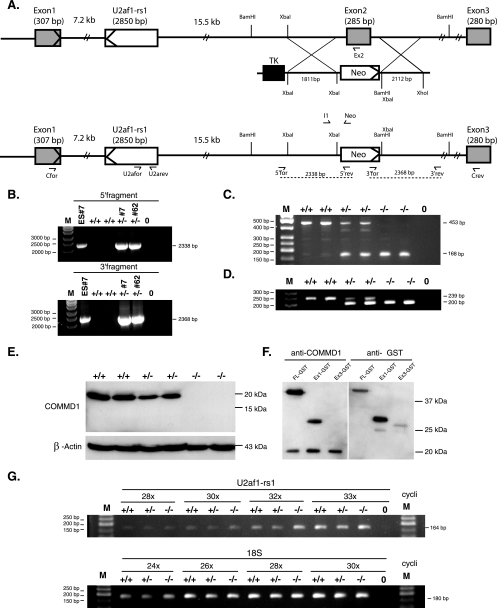
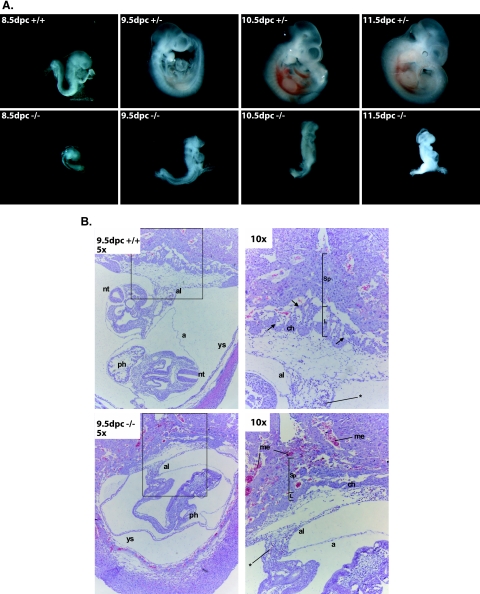
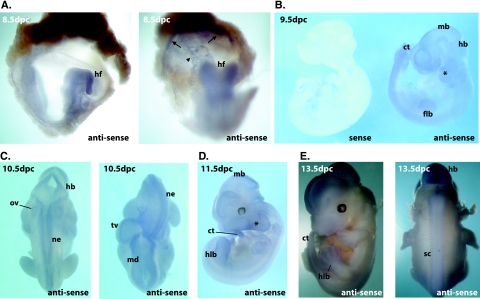
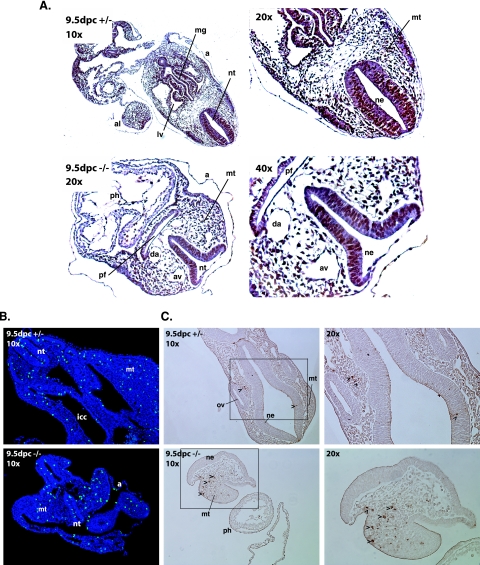
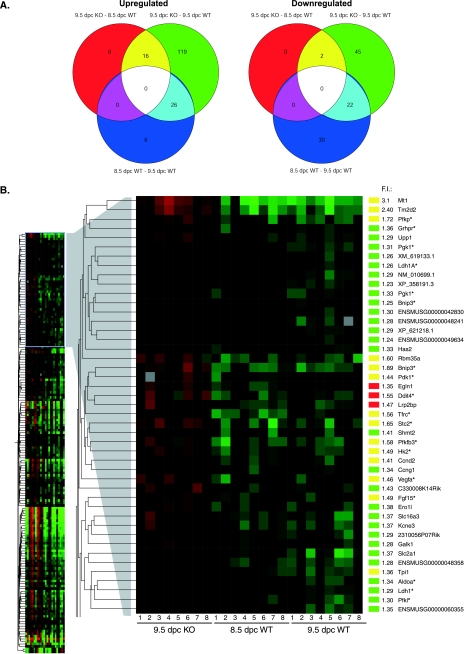
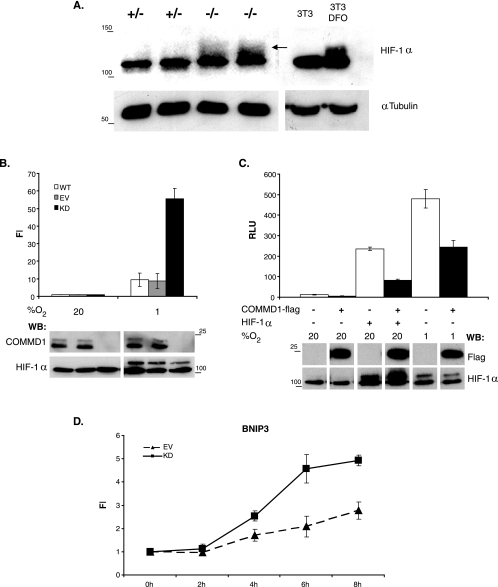
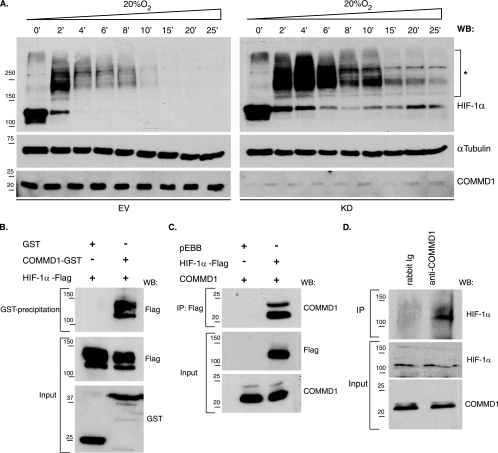
COMMD1 (previously known as MURR1) belongs to a novel family of proteins termed the copper metabolism gene MURR1 domain (COMMD) family. The 10 COMMD family members are well conserved between vertebrates, but the functions of most of the COMMD proteins are unknown. We recently established that COMMD1 is associated with the hepatic copper overload disorder copper toxicosis in Bedlington terriers. Recent in vitro studies indicate that COMMD1 has multiple functions, including sodium transport and NF-kappaB signaling. To elucidate the function of Commd1 in vivo, we generated homozygous Commd1 null (Commd1(-/-)) mice. Commd1(-/-) embryos died in utero between 9.5 and 10.5 days postcoitum (dpc), their development was generally retarded, and placenta vascularization was absent. Microarray analysis identified transcriptional upregulation of hypoxia-inducible factor 1 (HIF-1) target genes in 9.5-dpc Commd1(-/-) embryos compared to normal embryos, a feature that was associated with increased Hif-1alpha stability. Consistent with these observations, COMMD1 physically associates with HIF-1alpha and inhibits HIF-1alpha stability and HIF-1 transactivation in vitro. Thus, this study identifies COMMD1 as a novel regulator of HIF-1 activity and shows that Commd1 deficiency in mice leads to embryonic lethality associated with dysregulated placenta vascularization.


Figures

FIG. 1.
FIG. 1.
Targeted disruption of the Commd1 gene by homologous recombination. (A) Maps of the wild-type Commd1 allele, the targeting vector, and the targeted Commd1 allele. Shaded rectangles represent the three exons of the Commd1 gene. Open rectangle, the intronic gene U2af1-rs1. The orientations of the transcription of Commd1 and U2af1-rs1 are indicated by arrowheads within the first exons of the genes. The targeting vector contains the flanking genomic sequences, a neomycin gene (neo), and a thymidine kinase gene (tk). Homologous recombination is indicated by crossed lines and should result in the predicted targeted allele. Primers used for genotyping and RT-PCR are indicated by half-arrows. (B) PCR primers located outside the target sequences and primers localized inside the neo gene were used for PCR analysis to verify the correctly targeted ES cell clones. Genomic DNA was isolated from ES cell clone 7 and F1 progeny from independent lines 7 and 62. A 5′ fragment (2.3 kb) was amplified using sense primer 5′for and antisense primer 5′rev, and a 3′ fragment (2.4 kb) was amplified using sense primer 3′for and antisense primer 3′rev. (C) RT-PCR of wild-type, heterozygous, and homozygous Commd1 null embryos using primers Cfor and Crev. (D) PCR analysis of wild type (+/+), heterozygous (+/−), and homozygous Commd1 null (−/−) embryos using duplex PCR. (E) Immunoblot analysis of Commd1 and β-actin in 9.5-dpc embryos. (F) Immunoblot analysis of Commd1-GST (FL-GST), Commd1 exon 1-GST (Ex1-GST), and Commd1 exon 3-GST (Ex3-GST) in transfected HEK 293T cells using anti-Commd1 antiserum or anti-GST antibodies. (G) Semiquantitative RT-PCR analysis to determine the expression of U2af1-rs1 in relation to the expression of 18S rRNA in wild-type (+/+), heterozygous Commd1 null (+/−), and homozygous Commd1 null (−/−) 9.5-dpc embryos. The number of cycles used in this PCR is indicated (e.g., “28x” for 28 cycles). Demineralized water was used as a negative control (indicated by 0), and the size marker (M) is a 50-bp ladder.
FIG. 2.
FIG. 2.
Morphological and histological analysis of wild-type and mutant embryos. (A) Different developmental stages (8.5 to 11.5 dpc) of wild-type (+/+) and heterozygous Commd1 null (+/−) embryos and homozygous Commd1 null (−/−) littermates. The embryonic development of Commd1−/− mice was delayed and was arrested at 9.5 dpc compared to that of their littermates. No axial rotation was observed for Commd1−/− embryos. (B) Hematoxylin-and-eosin staining of saggital sections of wild-type and Commd1−/− embryos in the decidua at 9.5 dpc (inset in left panel is enlarged in right panel). Besides the developmental delay, no vascularization was observed in the placenta, and increased numbers of maternal erythrocytes were observed, for Commd1−/− embryos. The allantois (al) is fused with the chorionic plate (ch). Primitive embryonic blood cells (indicated by asterisks) are present throughout the Commd1−/− embryo. a, amnion; L, labyrinth; me, maternal erythrocytes; nt, neural tube; ph, primitive heart; Sp, spongiotrophoblast; ys, yolk sac.
FIG. 3.
FIG. 3.
Expression of Commd1 during the embryonic stages 8.5 to 12.5 dpc. Whole-mount in situ hybridization was performed using an antisense probe to detect Commd1 expression, and a sense probe was used as a negative control. (A) Expression of Commd1 at 8.5 dpc was observed throughout the embryo. Higher expression was seen in the headfold (hf) and in the allantois and chorionic plate (indicated by an arrowhead and arrows, respectively). (B to E) Diffuse expression of Commd1 was also seen at 9.5, 10.5, 11.5, and 13.5 dpc but was more distinct at the neural tube, limb buds, caudal region of the tail (ct), neuroepithelium (ne), and branchial arches (*). flb, forelimb bud; hlb, hindlimb bud; md, midbrain; hb, hindbrain; tv, telencephalic vesicle; ov, otic vesicle; sc, spinal cord.
FIG. 4.
FIG. 4.
Analyses of cell proliferation and apoptosis were performed by BrdU incorporation, anti-phosphohistone H3 immunohistochemistry, and TUNEL assays of transverse sections of Commd1+/ and Commd1−/− embryos at 9.5 dpc. (A) BrdU staining; (B) anti-phosphohistone H3 staining; (C) TUNEL assay (insets enlarged in right panels). Arrowheads indicate apoptotic cells. a, amnion; al, allantois; ph, primitive heart; mt, mesenchyme tissue; nt, neural tube; ne, neural epithelium; av, anterior cardinal vein; da, dorsal aorta; pf, pharyngeal region; icc, intraembryonic coelomic cavity; mg, midgut; ov, otic vesicle.
FIG. 5.
FIG. 5.
Genome-wide gene expression analysis of 9.5-dpc Commd1−/− embryos compared to 8.5- and 9.5-dpc normal embryos. (A) Venn diagrams show the numbers of genes that were significantly differentially expressed by the indicated comparison groups: 9.5-dpc Commd1−/− (KO) versus 8.5-dpc wild-type (WT) embryos, 9.5-dpc Commd1−/− versus 9.5-dpc wild-type embryos, and 8.5-dpc versus 9.5-dpc wild-type embryos. Data for upregulated and downregulated genes are given in the left and right panels, respectively. (B) Genes significantly upregulated in 9.5-dpc Commd1−/− embryos compared to each wild-type group are shown in a cluster diagram. The cluster of genes with increased mRNA expression in 9.5-dpc Commd1−/− embryos compared to both 8.5- and 9.5-dpc normal embryos is enlarged, and n-fold induction (F.I.) and gene names are given on the right. F.I. represents the mean expression of the genes in 9.5-dpc Commd1−/− embryos compared to the average expression in 8.5-dpc and 9.5-dpc normal embryos. The color bars correspond to the colors used in the Venn diagrams. Asterisks indicate the HIF-1 target genes, based on the literature.
FIG. 6.
FIG. 6.
Increased HIF-1α expression in Commd1−/− embryos and regulation of HIF-1-mediated transcription by COMMD1. (A) Immunoblot analysis of HIF-1α (arrow) and tubulin in 9.5-dpc embryos and in NIH 3T3 cells either left untreated or treated with DFO; the latter served as a control for distinguishing active Hif-1α. (B) HEK 293T cells with a stable knockdown of COMMD1 (KD) were cotransfected with 5×HRE-firefly luciferase reporter and Renilla luciferase control plasmids. HEK 293T cells (WT) and HEK 293T cells stably transfected with an empty siRNA vector (EV) were used as negative controls. Cells were incubated under normoxia or hypoxia. Firefly luciferase activities in the lysates were measured, corrected for Renilla luciferase activities, and expressed as n-fold induction (FI) relative to normoxic conditions. (C) HEK 293T cells were cotransfected with luciferase reporter plasmids as described for panel B, COMMD1-Flag, and/or HIF-1α and were incubated under normoxia or hypoxia. Luciferase activities in the lysates were measured and expressed as relative light units (RLU). All luciferase experiments were performed in triplicate. Error bars, standard deviations. Immunoblot analyses of HIF-1α, COMMD1, and COMMD-Flag protein expression are shown below the bar graphs. Sizes of molecular markers are given (in kilodaltons) on the left or right. WB, Western blot. (D) BNIP3 mRNA expression in HEK 293T KD and EV cells was determined at different time points during hypoxic exposure (3% O2) by qRT-PCR analysis. mRNA expression was normalized to the expression at time zero and is shown as the mean FI ± standard error of the mean for three biological replicates.
FIG. 7.
FIG. 7.
Increased HIF-1α protein stability in COMMD1 knockdown cells and association of COMMD1 with HIF-1α. (A) The stability of HIF-1α protein was determined in HEK 293T COMMD1 knockdown (KD) and control (EV) cells by immunoblot analysis. After the cells were cultured under hypoxic conditions (1% O2), they were exposed to 20% O2 for the indicated times. Asterisks indicate high-molecular-mass proteins detected by anti-HIF-1α. α-Tubulin expression was used as a loading control. WB, Western blot. (B) Glutathione-Sepharose precipitations using lysates of HEK 293T cells expressing HIF-1α-Flag, GST, or COMMD1-GST. (C) Flag immunoprecipitation using lysates of HEK 293T cells cotransfected with either HIF-1α-Flag or pEBB-Flag and COMMD1. (D) Endogenous COMMD1 immunoprecipitation using HEK 293T cell lysates. All precipitates were washed, separated by sodium dodecyl sulfate-polyacrylamide gel electrophoresis, and immunoblotted as indicated. “Input” indicates direct analysis of cell lysates. Ig, immunoglobulin. Sizes of molecular markers are given in kilodaltons on the left.

Similar articles

Cited by

References

    1. Aprelikova, O., G. V. Chandramouli, M. Wood, J. R. Vasselli, J. Riss, J. K. Maranchie, W. M. Linehan, and J. C. Barrett. 2004. Regulation of HIF prolyl hydroxylases by hypoxia-inducible factors. J. Cell. Biochem. 92:491-501. - PubMed
    1. Bianchi, L., L. Tacchini, and G. Cairo. 1999. HIF-1-mediated activation of transferrin receptor gene transcription by iron chelation. Nucleic Acids Res. 27:4223-4227. - PMC - PubMed
    1. Biasio, W., T. Chang, C. J. McIntosh, and F. J. McDonald. 2004. Identification of Murr1 as a regulator of the human delta epithelial sodium channel. J. Biol. Chem. 279:5429-5434. - PubMed
    1. Brummelkamp, T. R., R. Bernards, and R. Agami. 2002. Stable suppression of tumorigenicity by virus-mediated RNA interference. Cancer Cell 2:243-247. - PubMed
    1. Brummelkamp, T. R., R. Bernards, and R. Agami. 2002. A system for stable expression of short interfering RNAs in mammalian cells. Science 296:550-553. - PubMed

Publication types

MeSH terms