

MultiSeq: unifying sequence and structure data for evolutionary analysis
- PMID: 16914055
- PMCID: PMC1586216
- DOI: 10.1186/1471-2105-7-382
MultiSeq: unifying sequence and structure data for evolutionary analysis
Abstract
Background: Since the publication of the first draft of the human genome in 2000, bioinformatic data have been accumulating at an overwhelming pace. Currently, more than 3 million sequences and 35 thousand structures of proteins and nucleic acids are available in public databases. Finding correlations in and between these data to answer critical research questions is extremely challenging. This problem needs to be approached from several directions: information science to organize and search the data; information visualization to assist in recognizing correlations; mathematics to formulate statistical inferences; and biology to analyze chemical and physical properties in terms of sequence and structure changes.
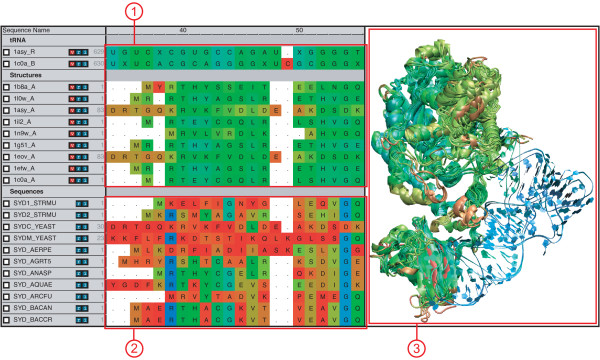
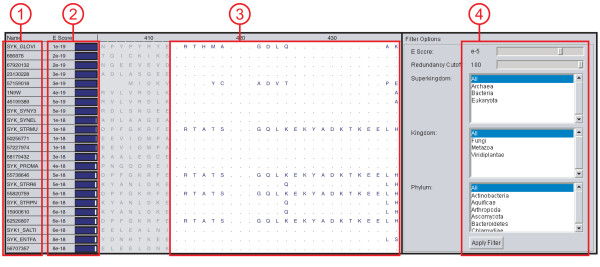
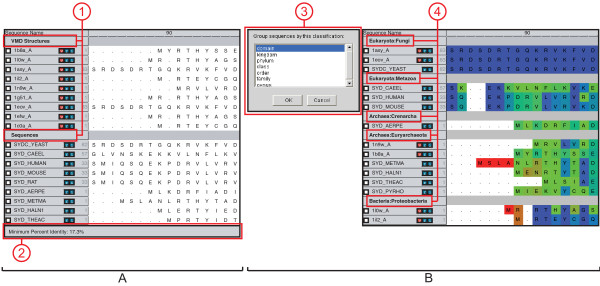
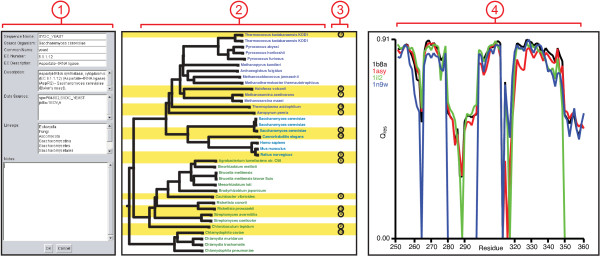
Results: Here we present MultiSeq, a unified bioinformatics analysis environment that allows one to organize, display, align and analyze both sequence and structure data for proteins and nucleic acids. While special emphasis is placed on analyzing the data within the framework of evolutionary biology, the environment is also flexible enough to accommodate other usage patterns. The evolutionary approach is supported by the use of predefined metadata, adherence to standard ontological mappings, and the ability for the user to adjust these classifications using an electronic notebook. MultiSeq contains a new algorithm to generate complete evolutionary profiles that represent the topology of the molecular phylogenetic tree of a homologous group of distantly related proteins. The method, based on the multidimensional QR factorization of multiple sequence and structure alignments, removes redundancy from the alignments and orders the protein sequences by increasing linear dependence, resulting in the identification of a minimal basis set of sequences that spans the evolutionary space of the homologous group of proteins.
Conclusion: MultiSeq is a major extension of the Multiple Alignment tool that is provided as part of VMD, a structural visualization program for analyzing molecular dynamics simulations. Both are freely distributed by the NIH Resource for Macromolecular Modeling and Bioinformatics and MultiSeq is included with VMD starting with version 1.8.5. The MultiSeq website has details on how to download and use the software: http://www.scs.uiuc.edu/~schulten/multiseq/
Figures
Similar articles
-
Evolutionary profiles derived from the QR factorization of multiple structural alignments gives an economy of information.J Mol Biol. 2005 Feb 25;346(3):875-94. doi: 10.1016/j.jmb.2004.11.053. Epub 2005 Jan 22. J Mol Biol. 2005. PMID: 15713469
-
Multiple Alignment of protein structures and sequences for VMD.Bioinformatics. 2006 Feb 15;22(4):504-6. doi: 10.1093/bioinformatics/bti825. Epub 2005 Dec 8. Bioinformatics. 2006. PMID: 16339280
-
Evolutionary profiles from the QR factorization of multiple sequence alignments.Proc Natl Acad Sci U S A. 2005 Mar 15;102(11):4045-50. doi: 10.1073/pnas.0409715102. Epub 2005 Mar 1. Proc Natl Acad Sci U S A. 2005. PMID: 15741270 Free PMC article.
-
State-of-the-art bioinformatics protein structure prediction tools (Review).Int J Mol Med. 2011 Sep;28(3):295-310. doi: 10.3892/ijmm.2011.705. Epub 2011 May 23. Int J Mol Med. 2011. PMID: 21617841 Review.
-
Petabase-Scale Homology Search for Structure Prediction.Cold Spring Harb Perspect Biol. 2024 May 2;16(5):a041465. doi: 10.1101/cshperspect.a041465. Cold Spring Harb Perspect Biol. 2024. PMID: 38316555 Review.
Cited by
-
Characterization of Danio rerio Mn2+-dependent ADP-ribose/CDP-alcohol diphosphatase, the structural prototype of the ADPRibase-Mn-like protein family.PLoS One. 2012;7(7):e42249. doi: 10.1371/journal.pone.0042249. Epub 2012 Jul 27. PLoS One. 2012. PMID: 22848751 Free PMC article.
-
Catalytic transitions in the human MDR1 P-glycoprotein drug binding sites.Biochemistry. 2012 Jun 26;51(25):5125-41. doi: 10.1021/bi300299z. Epub 2012 Jun 12. Biochemistry. 2012. PMID: 22647192 Free PMC article.
-
Emergence of the universal genetic code imprinted in an RNA record.Proc Natl Acad Sci U S A. 2006 Nov 28;103(48):18095-100. doi: 10.1073/pnas.0608762103. Epub 2006 Nov 16. Proc Natl Acad Sci U S A. 2006. PMID: 17110438 Free PMC article.
-
Structure of an archaeal non-discriminating glutamyl-tRNA synthetase: a missing link in the evolution of Gln-tRNAGln formation.Nucleic Acids Res. 2010 Nov;38(20):7286-97. doi: 10.1093/nar/gkq605. Epub 2010 Jul 3. Nucleic Acids Res. 2010. PMID: 20601684 Free PMC article.
-
A structural analysis of the AAA+ domains in Saccharomyces cerevisiae cytoplasmic dynein.J Struct Biol. 2014 Jun;186(3):367-75. doi: 10.1016/j.jsb.2014.03.019. Epub 2014 Mar 28. J Struct Biol. 2014. PMID: 24680784 Free PMC article.
References
Publication types
MeSH terms
Substances
Grants and funding
LinkOut - more resources
Full Text Sources
