. 2023 Oct 16:12:RP87151.
doi: 10.7554/eLife.87151.

σ28-dependent small RNA regulation of flagella biosynthesis

Affiliations

σ28-dependent small RNA regulation of flagella biosynthesis

Sahar Melamed et al. Elife. .

Abstract

Flagella are important for bacterial motility as well as for pathogenesis. Synthesis of these structures is energy intensive and, while extensive transcriptional regulation has been described, little is known about the posttranscriptional regulation. Small RNAs (sRNAs) are widespread posttranscriptional regulators, most base pairing with mRNAs to affect their stability and/or translation. Here, we describe four UTR-derived sRNAs (UhpU, MotR, FliX and FlgO) whose expression is controlled by the flagella sigma factor σ28 (fliA) in Escherichia coli. Interestingly, the four sRNAs have varied effects on flagellin protein levels, flagella number and cell motility. UhpU, corresponding to the 3´ UTR of a metabolic gene, likely has hundreds of targets including a transcriptional regulator at the top flagella regulatory cascade connecting metabolism and flagella synthesis. Unlike most sRNAs, MotR and FliX base pair within the coding sequences of target mRNAs and act on ribosomal protein mRNAs connecting ribosome production and flagella synthesis. The study shows how sRNA-mediated regulation can overlay a complex network enabling nuanced control of flagella synthesis.

Keywords: E. coli; Hfq; RIL-seq; S10; flagella; fliA; genetics; genomics; infectious disease; microbiology; post-transcriptional regulation.


Conflict of interest statement

SM, AZ, MJ, JM, AS, HZ, GS No competing interests declared

Figures
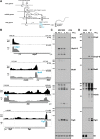
Figure 1.
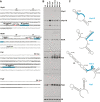
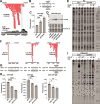
Figure 1.. σ28-Dependent sRNAs are primarily expressed in log phase.
(A) Overview of the flagellar regulon. The early genes initiate the transcription of the middle genes, including fliA which encodes σ28. In turn, σ28 initiates the transcription of the late genes and enhances the transcription of some of the middle genes. For the middle and late genes, only selected operons are shown. The sRNAs analyzed in this study are colored in blue. This model was inspired by Kalir et al., 2005. (B) Browser images showing levels of UhpU, MotR, FliX, and FlgO sRNAs in total RNA (black) and Hfq co-immunoprecipitation (gray) libraries. Normalized read count ranges are shown in the upper right of each frame. Data analyzed is from (RIL-seq experiment 1, Melamed et al., 2020). (C) Northern blot analysis of total RNA from WT (GSO983) or ∆fliA (GSO1068) cells grown to the indicated time points. A full-length transcript (~260 nt) and several processed transcripts, of which one is predominant (UhpU-S,~60 nt), are detected for UhpU, one prominent band (~95 nt) is detected for MotR, one prominent band (~200 nt) is detected for FliX, and two bands close in size (~75 nt) are detected for FlgO. (D) Northern blot analysis of WT (GSO983) cells grown to OD600 ~0.6 and~1.0. RNA was extracted from total lysates as well as samples from co-immunoprecipitation with Hfq, separated on an acrylamide gel, transferred to a membrane, and probed for σ28-dependent sRNAs. A~100 nt FliX band (FliX-S) was revealed immunoprecipitating with Hfq. In (C) and (D), RNAs were probed sequentially on the same membrane, and the 5S RNA served as a loading control.
Figure 1—figure supplement 1.
Figure 1—figure supplement 1.. Sequences and predicted structures of UhpU, MotR, FliX, and FlgO sRNAs and effect of carbon source on sRNA levels.
(A) Genomic regions of σ28-dependent sRNAs. sRNAs sequences are in bold. The two FlgO bands (Figure 1C and D) likely result from differential processing and the bold sequence corresponds to the higher molecular weight band. Stop codons are indicated in red whereas start codons are indicated in green. The –10 and –35 regions of the uhpU and motR promoters are in italics and underlined. Regions highlighted in blue reflect the suggested seed sequences (Melamed et al., 2016) and the regions that base pair with the targets tested in this study for uhpU, motR and fliX. The uhpU-S and fliX-S sequences are underlined. The uhpU-M1, uhpU-M2, motR*, motR-M1 and fliX-M1 mutations are labeled in the corresponding sequences. The regions highlighted in gray denote the REP sequences in fliX. (B) Expression of σ28-dependent sRNAs in cells grown in different carbon sources. Total RNA was extracted from WT (GSO983) cells grown to exponential phase (OD600~0.6) in LB medium or M63 minimal medium supplemented with 0.2% of glucose, glucose-6-phosphate (G6P), ribose, maltose, or galactose or 0.4% glycerol, separated on an acrylamide gel and sequentially probed for UhpU, MotR, FliX, FlgO and 5S RNAs. This is the same membrane probed for the RbsZ sRNA and 5S RNA (same panel) in Supp. Figure S8A of Melamed et al., 2020. (C) Structures of UhpU-S, MotR, FliX-S and FlgO predicted by mfold (Zuker, 2003). Numbering for full-length UhpU and FliX is indicated in parentheses. Base pairing regions are highlighted in blue as in (A).
Figure 1—figure supplement 2.
Figure 1—figure supplement 2.. UhpU, MotR, FliX and FlgO levels across growth.
Expression of σ28-dependent sRNAs in cells across growth. Total RNA was extracted from WT (GSO983) cells grown to the indicated time points. RNA was separated on an acrylamide gel and sequentially probed for all four σ28-dependent sRNAs and the 5S RNA. A full-length transcript (~260 nt) and several processed transcripts, of which one is predominant (UhpU-S,~60 nt), are detected for UhpU, one prominent band (~95 nt) is detected for MotR, one prominent band (~200 nt) is detected for FliX, and two close bands close in size (~75 nt) are detected for FlgO.
Figure 2.
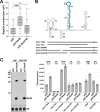
Figure 2.. Overexpression of the σ28-dependent sRNAs leads to differences in flagella number and motility.
(A) Moderate increase in flagella number with UhpU overexpression based on EM analysis for WT (crl-) cells carrying an empty vector or overexpressing UhpU. (B) Increased motility with UhpU overexpression based on motility in 0.3% agar for WT (crl+) cells carrying an empty vector or overexpressing UhpU. (C) Increase in flagella number with MotR overexpression based on EM analysis for WT (crl-) cells carrying an empty vector or overexpressing MotR. (D) Slight increase in motility with MotR overexpression based on motility in 0.3% agar for WT (crl+) cells carrying an empty vector or overexpressing MotR. (E) Reduction in flagella number with FliX overexpression based on EM analysis for WT (crl-) cells carrying an empty vector or overexpressing FliX. (F) Reduced motility with FliX overexpression based on motility in 0.3% agar for WT (crl-) cells carrying an empty vector or overexpressing FliX. (G) No change in flagella number with FlgO overexpression based on EM analysis for WT (crl-) cells carrying an empty vector or overexpressing FlgO. (H) No change in motility with FlgO overexpression based on motility in 0.3% agar for WT (crl-) cells carrying an empty vector or overexpressing FlgO. Cells in (A) and (B) were induced with 1 mM IPTG. Quantification for all the assays is shown on the right. For (A), (C), (E) and (G) quantification of the number of flagella per cell was done by counting the flagella for 20 cells (black dots), and a one-way ANOVA comparison was performed to calculate the significance of the change in flagella number (ns = not significant, **=p < 0.01, ****=p < 0.0001). Each experiment was repeated three times, and one representative experiment is shown. The bottom and top of the box are the 25th and 75th percentiles, the line inside the box is the median, the lower and the upper whiskers represent the minimum and the maximum values of the dataset, respectively. While some differences in cells size and width were observed in the EM analysis, they were not statistically significant. The experiments presented in (C) and (E) were carried out on same day, and the same pZE sample is shown. Graphs for (B), (D), (F) and (H) show the average of nine biological repeats. Error bars represent one SD, and a one-way ANOVA comparison was performed to calculate the significance of the change in motility (ns = not significant, *=p < 0.05, ****=p < 0.0001). The scales given in (A) and (B) are the same for all EM images and all motility plates, respectively.
Figure 2—figure supplement 1.
Figure 2—figure supplement 1.. Expression of σ28-dependent sRNAs from plasmids and the effect of MotR and FliX overexpression on growth.
(A) Expression of σ28-dependent sRNAs from plasmids. Total RNA was extracted from WT (GSO983) cells harboring plasmids indicated in the figure and grown to exponential phase (OD600~0.2) (with or without 1 mM IPTG for UhpU). RNA was separated on an acrylamide gel and sequentially probed for the indicated sRNA (UhpU, MotR, FliX, or FlgO). Subsequently, the blots were stripped and probed for the control 5S RNA. Higher bands were detected for MotR and FliX expressed from the pZE plasmid, likely due to some terminator readthrough. (B) Growth curves of WT (GSO983) harboring indicated plasmids grown in LB medium. Overnight cultures were diluted to OD600=0.05 and cell growth was monitored for 440 min by OD600 measurements.
Figure 2—figure supplement 2.
Figure 2—figure supplement 2.. Effects of MotR* and FliX-S overexpression on flagella number and motility.
(A) Increase in flagella number with MotR* overexpression based on EM analysis for WT (crl-) cells carrying an empty vector or overexpressing MotR*. (B) No significant change in motility with MotR* overexpression based on motility in 0.3% agar for WT (crl+) cells carrying an empty vector or overexpressing MotR*. (C) Reduction in flagella number with FliX-S overexpression based on EM analysis for WT (crl-) cells carrying an empty vector or overexpressing FliX-S. (D) Reduced motility with FliX-S overexpression based on motility in 0.3% agar for WT (crl-) cells carrying an empty vector or overexpressing FliX-S. The scales given in (A) and (B) are the same for all EM images and all motility plates, respectively.
Figure 3.
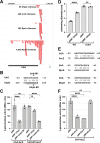
Figure 3.. Multiple sRNAs repress LrhA synthesis.
(A) Browser image showing chimeras (in red) for UhpU, ArcZ, RprA and McaS, at the 5´ UTR region of lrhA. Blue highlighting indicates position of sRNA-lrhA base pairing. Data analyzed is from Melamed et al., 2020. (B) Base-pairing between lrhA and UhpU with sequences of mutants assayed. Seed sequence predicted by Melamed et al., 2016 is underlined. Numbering is from AUG of lrhA mRNA and +1 of UhpU sRNA. (C) UhpU represses lrhA-lacZ fusion based on β-galactosidase assay detecting the levels of lrhA-lacZ and lrhA-M1-lacZ translational fusions in response to UhpU and UhpU-M1 overexpression. (D) UhpU does not affect motility when LrhA is absent, based on motility in 0.3% agar for WT (crl+) cells or ΔlrhA cells (GSO1179) carrying an empty vector or overexpressing UhpU. Graph shows the average of three biological repeats, and error bars represent one SD. One-way ANOVA comparison was performed to calculate the significance of the change in motility (ns = not significant, ****=p < 0.0001). (E) Predicted base-pairing between lrhA and ArcZ, RprA or McaS. Numbering is from AUG of lrhA mRNA and +1 of indicated sRNAs. (F) Down regulation of lrhA by ArcZ and RprA but not McaS based on β-galactosidase assay detecting the levels of lrhA-lacZ translational fusions in response to ArcZ, RprA and McaS overexpression. For (C) and (F), graphs show the average of three biological repeats, and error bars represent one SD. One-way ANOVA comparison was performed to calculate the significance of the change in β-galactosidase activity (ns = not significant, ****=p < 0.0001).
Figure 3—figure supplement 1.
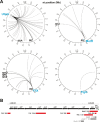
Figure 3—figure supplement 1.. Interactomes for σ28-dependent sRNAs.
(A) Circos plots showing σ28-dependent sRNAs targets that were detected in at least four of the six RIL-seq conditions. Each sRNA has a unique pattern of partners. UhpU is hub that binds hundreds of targets, MotR and FliX have smaller datasets and FlgO only has one target even though it is one of the most abundant sRNAs on Hfq. Targets that were examined in this study are labeled on the plots. Circos plots were drawn using R RCircos Package (Zhang et al., 2013a). (B) Schematic representation of the S10 operon with positions of sRNA binding. sRNAs that have more than 100 chimeras with genes from the S10 operon are shown. Numbers in the brackets represent the number of chimeras. Data analyzed is from (RIL-seq experiment 1, Melamed et al., 2020).
Figure 4.
Figure 4.. Multiple sRNAs regulate flagellin synthesis.
(A) Browser image showing chimeras (red and blue) for UhpU, MotR, and FliX at the fliCX region. Data analyzed is from (RIL-seq experiment 1, Melamed et al., 2020). Red and blue lines indicate the RNA in the region is first or second RNA in the chimera, respectively. Blue highlighting indicates position of sRNA-fliC base pairing. (B) Immunoblot analysis showing UhpU and MotR overexpression leads to increased flagellin levels and FliX overexpression leads to reduced flagellin levels in the cytosol. Flagellin levels were determined by immunoblot analysis using α-FliC antibody. A sample from a ∆fliC strain was included as a control given the detection of a cross-reacting band slightly larger than flagellin. The Ponceau S-stained membrane serves as a loading control. Cells were grown with shaking at 180 rpm to OD600 ~1.0, and cell fractions were separated by a series of centrifugation steps as detailed in Materials and Methods. (C) Northern blot analysis showing UhpU and MotR overexpression increases fliC mRNA levels and FliX overexpression reduces fliC levels across growth. The 5S RNA served as a loading control. The variation in fliC levels in the pBR* and pZE control samples is due to the different strain backgrounds (crl + versus crl-) and the length of membrane exposure to film. (D) Predicted base-pairing between fliC and UhpU, MotR, or FliX. Seed sequences predicted by Melamed et al., 2016 or by this study are underlined. Numbering is from AUG of fliC mRNA and +1 of indicated sRNAs.
Figure 4—figure supplement 1.
Figure 4—figure supplement 1.. Effects of UhpU, MotR* and FliX-S overexpression on flagellin and fliC mRNA levels.
(A) An expanded view of the immunoblot analysis shown in Figure 4B. UhpU and MotR overexpression leads to increased flagellin levels and FliX overexpression leads to reduced flagellin levels. Bacterial cells were fractionated to separate the flagellin cytosolic monomers from the polymerized flagella, and flagellin levels were determined by immunoblot analysis using α-FliC antibody. Numbers below the blots represent the fold change relative to the relevant pZE sample. (B) Northern blot analysis showing MotR* overexpression increases fliC mRNA levels and FliX-S overexpression reduces fliC mRNA levels. The 5S RNA served as a loading control. The differences in fliC levels in the pZE control samples are due differences in the length of exposure to film.
Figure 4—figure supplement 2.
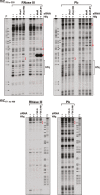
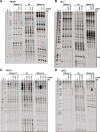
Figure 4—figure supplement 2.. In vitro structural probing of interaction between UhpU, MotR, and FliX sRNAs with fliC mRNA.
In vitro transcribed and 32P-labeled fliC fragments (−70–220 and 171–460 relative to the AUG of the fliC open reading frame) were treated with RNase III for 1.5 min or lead for 10 min with or without Hfq and unlabeled UhpU, UhpU-M2, MotR, MotR-M1, FliX-S and FliX-S-M1, and separated, alongside T1 ladder, on sequencing gels. Changes in cleavage patterns due to the presence of an sRNA, which overlap regions of predicted base pairing, are indicated by the thick red brackets. Asterisks mark increased cleavage, possibly suggesting a change in folding, in the presence of either WT or mutant MotR, and the thin red brackets indicate a possible second site of MotR base pairing. Changes in the cleavage patterns due to Hfq binding are indicated by black brackets. Based on more relative cleavage with RNase III and less cleavage with lead, the fliC-70 to 220 fragment is more double-stranded than the fliC171-460 fragment. Numbering is from AUG of fliC CDS.
Figure 5.
Figure 5.. MotR and FliX base pair with the S10 mRNA leading to upregulation and downregulation, respectively.
(A) Browser image showing MotR chimeras (in red) in S10 leader and rpsJ region. Data analyzed is from (RIL-seq experiment 1, Melamed et al., 2020). Coverage of the region in total RNA-seq libraries is shown for empty vector (pZE) and for pZE-MotR* overexpression (Supplementary file 2). The MotR and Hfq binding sites as detected in Figure 5—figure supplement 2A and B are highlighted in light blue. (B) Base-pairing between rpsJ and MotR with sequences of mutants assayed. Predicted MotR seed sequence is underlined. Numbering is from +1 of rpsJ mRNA and MotR sRNA. (C) MotR induces rpsJ-gfp reporter fusion based on reporter assays of rpsJ-gfp expressed from pXG10-SF with MotR or MotR* expressed from pZE. (D) MotR increases FLAG-tagged S10 levels. 3XFLAG-S10 was expressed from pBAD33 and MotR or MotR* was expressed from pZE. A mutation in MotR eliminates this regulation. 3XFLAG-S10 levels were determined by immunoblot analysis using α-FLAG antibody. The Ponceau S-stained membrane serves as a loading control. (E) Changes in RNase III-mediated cleavage of rpsJ due to MotR. 32P-labeled rpsJ and rpsJ-M1 were treated with lead for 10 min with or without MotR and MotR-M1 and separated on a sequencing gel. Region protected by MotR binding, which overlaps the predicted base pairing sequence, is indicated by the red bracket. Numbering is from +1 of rpsJ mRNA. (F) Browser image showing FliX chimeras (in red) in the S10 operon. Highlighted in light blue are the base pairing regions between FliX and the S10 operon mRNA. Data analyzed is from (RIL-seq experiment 1, Melamed et al., 2020). (G) Base pairing between rplC, rpsS, rpsQ, and FliX with sequences of mutants assayed. FliX seed sequence predicted by Melamed et al., 2016 is underlined. Numbering is from AUG of indicated CDS and +1 of FliX sRNA. (H) Test of FliX interactions with reporter assays of rplC-gfp, rpsS-rplV-gfp, and rpsQ-gfp expressed from pXG10-SF or pXG30-SF and FliX or FliX-S expressed from pZE. (I) Changes in RNase III-mediated cleavage of rpsS due to FliX-S. 32P-labeled rpsS and rpsS-M1 were treated with RNase III for 1.5 min with or without FliX-S and FliX-S -M1 and separated on a sequencing gel. Region protected by FliX binding, which overlaps the predicted base pairing sequence, is indicated by the red bracket. Numbering is from AUG of rpsS CDS. For (C) and (H), the average of three independent measurements is shown. Error bars represent one SD. One-way ANOVA comparison was performed to calculate the significance of the change in GFP signal (ns = not significant, *=p < 0.05, **=p < 0.01, ****=p < 0.0001).
Figure 5—figure supplement 1.
Figure 5—figure supplement 1.. Effects of MotR mutants on flagella number and rpsJ expression.
(A) MotR-M1 overexpression does not increase flagella number. Quantification of the number of flagella per cell by EM analysis for WT (GSO983) cells harboring the plasmids as indicated in the figure. One-way ANOVA comparison was performed to calculate the significance of the change in flagella number (ns = not significant, ****=p < 0.0001). Box plot and error bars descriptions are as in Figure 2. (B) MotR induces rpsJ-gfp levels only when the S10 leader and MotR binding sites are present. S10 leader sequence and secondary structure based on Zengel et al., 2002 (top). Hfq binding region is highlighted in blue. rpsJ start codon is labeled in green. The first boxed letters represent S10 leader terminator, and the second boxed letters represent the Shine-Dalgarno sequence. Lines (middle) represent the parts of the sequences that were assayed in the GFP reporter assay in bottom panel. Reporter assays of various rpsJ-gfp fusions expressed from pXG10-SF with MotR* expressed from pZE. One-way ANOVA comparison was performed to calculate the significance of the change in GFP signal (ns = not significant, **=p < 0.01, ****=p < 0.0001). (C) Northern blot analysis of total RNA from hfq+ (GSO614), and hfqY25D (GSO1110) grown to OD600~0.2. The hfq+ and hfqY25D strains carried pZE and pZE-MotR*. Similar levels of MotR* RNA were detected for the hfq +and hfqY25D mutant backgrounds. Membranes were probed for MotR and then for 5S RNA as a loading control.
Figure 5—figure supplement 2.
Figure 5—figure supplement 2.. In vitro structural probing of interaction between MotR sRNA and rpsJ mRNA, and FliX sRNA and rpsS mRNA.
(A) In vitro transcribed and 32P-labeled MotR was treated with RNase T1 for 10 min, lead for 10 min or RNase III for 1.5 min with or without rpsJ, rplC and Hfq, and separated, alongside OH and T1 ladders, on a sequencing gel. Changes in cleavage pattern due to the presence of rpsJ, overlapping region of predicted base pairing, are indicated by thick blue brackets. Thin blue brackets indicate a possible second site of base pairing. Numbering is from +1 of MotR. (B) In vitro transcribed and 32P-labeled S10 leader and rpsJ was treated with RNase T1 for 10 min, lead for 10 min or RNase III for 1.5 min with or without MotR, FliX-S and Hfq, and separated, alongside OH and T1 ladders, on a sequencing gel. Changes in the cleavage patterns due to the presence of MotR, overlapping region of predicted base pairing, are indicated by thick red brackets, and changes in the cleavage patterns due to Hfq binding are indicated by black brackets. Numbering is from +1 of rpsJ mRNA. (C) In vitro transcribed and 32P-labeled FliX-S (with extra 3 nt on its 5´ end as specified in Supplementary file 3) was treated with RNase T1 for 10 min, lead for 10 min or RNase III for 1.5 min with or without rpsS, rpsJ, rplC and Hfq, and separated, alongside OH and T1 ladders, on a sequencing gel. Changes in the cleavage patterns due to the presence of rpsS, overlapping region of predicted base pairing, are indicated by thick blue brackets. Numbering is from +1 of FliX. (D) In vitro transcribed and 32P-labeled rpsS was treated with RNase T1 for 10 min, lead for 10 min or RNase III for 1.5 min with or without MotR, FliX-S and Hfq, and separated, alongside OH and T1 ladders, on a sequencing gel. Changes in the cleavage patterns due to the presence of FliX-S, overlapping region of predicted base pairing, are indicated by thick red brackets. Numbering is from AUG of rpsS CDS.
Figure 5—figure supplement 3.
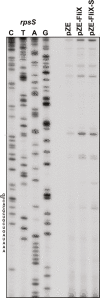
Figure 5—figure supplement 3.. In vivo effects of FliX and FliX-S overproduction on rpsS mRNA.
Total RNA was extracted from a WT strain (GSO983) harboring the indicated plasmids grown to OD600~0.6 and then subject to primer extension analysis using a primer hybridizing downstream of FliX binding site on the rpsS mRNA.
Figure 6.
Figure 6.. MotR overexpression leads to a nusB-dependent increase in expression from flagellar operons.
(A) MotR* and S10∆loop overexpression increase the number of flagella. The number of flagella per cell detected by EM were counted for WT cells (GSO983) harboring the indicated plasmids. (B) MotR effect is eliminated in ∆nusB background. The number of flagella per cell detected by EM were counted for WT (GSO983) or ∆nusB cells (GSO1077) harboring the indicated plasmids. (C) MotR induces mRNA levels throughout the flagellar operons in WT background (GSO983) but not in ∆nusB background (GSO1077). MotR was expressed from pZE plasmid and the levels of motB, cheW, tar, cheZ, ssrA and cadB were monitored in comparison to their levels in the pZE control vector by RT-qPCR. cadB served as a non-flagellar gene control and ssrA served as a reference gene; the same cadB data is shown in both plots. Experiments were done in three biological replicates and one-way ANOVA comparison was performed to calculate the significance of the change in mRNA levels (ns = not significant, ****=p < 0.0001). For (A) and (B), flagella were counted for 20 cells (black dots), and a one-way ANOVA comparison was performed to calculate the significance of the change in flagella number (ns = not significant, ****=p < 0.0001). Box plot and error bars descriptions as in Figure 2. Each experiment was repeated three times, and one representative experiment is shown.
Figure 6—figure supplement 1.
Figure 6—figure supplement 1.. Effects of MotR* and S10∆loop overexpression are lost in ∆nusB background.
(A) S10∆loop effect is eliminated in ∆nusB background. The number of flagella per cell detected by EM were counted for WT (GSO983) or ∆nusB (GSO1077) cells harboring the indicated plasmids. Flagella were counted for 20 cells (black dots), and a one-way ANOVA comparison was performed to calculate the significance of the change in flagella number (ns = not significant, ***=p < 0.001). Box plot and error bars descriptions as in Figure 2. (B) MotR* effect on flagellar operons is eliminated in ∆nusB background (GSO1077). MotR* was expressed from pZE plasmid and the levels of motB, cheW, tar, cheZ, ssrA and cadB were monitored in comparison to their levels in the pZE control vector by RT-qPCR. cadB served as a non-flagellar gene control and ssrA served as a reference gene. Experiments were done in three biological replicates and one-way ANOVA comparison was performed to calculate the significance of the change in mRNA levels (ns = not significant, ***=p < 0.001, ****=p < 0.0001).
Figure 7.
Figure 7.. MotR and FliX overproduction leads to increased and decreased expression of flagellar genes, respectively.
(A) MotR* induces flagellar genes. Green symbols represent flagellar regulon genes as indicated on the graph. (B) FliX reduces flagellar genes. Red symbols represent flagellar regulon genes as indicated on the graph. In (A) and (B), differential expression analysis was conducted with DESeq2. The threshold for differentially expressed transcripts was set to adjusted value of P<0.05. (C) MotR overexpression increases the activity of gfp fusions to PflgB and PfliL. (D) FliX overexpression decreases the activity of gfp fusions to PflgB and PfliL. In (C) and (D), the promoter activities were monitored for 330 min by measuring the GFP signal and dividing it with the culture OD600nm. For (A) and (B), WT (GSO983) harboring the control vector pZE or the MotR* or the FliX expression plasmid were grown to OD600 ~0.2; total RNA was extracted and used for the construction of cDNA libraries, which were analyzed as described in Materials and methods. For (C) and (D), three biological repeats are shown in the graph. One-way ANOVA comparison was performed to calculate the significance of the change in GFP signal (ns = not significant, *=p < 0.05, **=p < 0.01, ***=p < 0.001, ****=p < 0.0001). The experiments presented in (C) and Figure 7—figure supplement 2B, and in (D) and Figure 7—figure supplement 2A, were carried out on same day, respectively, and the same pZE samples are shown.
Figure 7—figure supplement 1.
Figure 7—figure supplement 1.. Overlap in MotR* overexpression profile with σ28 regulon.
(A) Deletion of fliA reduces σ28-dependent genes. RNA-seq data for ∆fliA from Fitzgerald et al., 2014 was reanalyzed. Differential expression analysis was conducted with DESeq2, and threshold for differentially expressed transcripts was set to adjusted value of p<0.05. Red symbols represent flagella regulon genes as indicated on the graph. (B) On top is the motif found for promoters of transcription units for genes whose expression increased the most (FDR = 0.05 and≥2 fold) upon MotR* overexpression (E-value: 5.1e–14). Of the 70 total sequences analyzed, 25 contain the motif. The bottom motif corresponds to a σ28 recognition motif (Fitzgerald et al., 2014).
Figure 7—figure supplement 2.
Figure 7—figure supplement 2.. Effects of MotR* and FliX-S overexpression on PflgB-gfp, PfliL-gfp and FlgJ-SPA expression.
(A) MotR* overexpression increases the activity of gfp fusions to PflgB and PfliL. The promoter activities were monitored for 330 min by measuring the GFP signal and dividing it with the culture OD600nm. (B) FliX-S overexpression decreases the activity of gfp fusions to PflgB and PfliL. The promoter activities were monitored for 330 min by measuring the GFP signal and dividing it with the culture OD600nm. (C) MotR* increases the levels of SPA-tagged FlgJ. FlgJ-SPA levels across growth of WT (GSO1080) cells carrying indicated plasmids were determined by immunoblot analysis using α-FLAG antibody. (D) FliX-S reduces the levels of SPA tagged-FlgJ. FlgJ-SPA levels across growth of WT (GSO1080) cells carrying the indicated plasmids were determined by immunoblot analysis using α-FLAG antibody. For (A) and (B), three biological repeats are shown in the graph. One-way ANOVA comparison was performed to calculate the significance of the change in GFP signal (ns = not significant, *=p < 0.05, **=p < 0.01, ***=p < 0.001, ****=p < 0.0001). The experiments presented in Figure 5D and (A), and in Figure 5C and (B), were carried out on same day, respectively, and the same pZE samples are shown. For (C) and (D), the Ponceau S-stained membrane serves as a loading control.
Figure 8.
Figure 8.. Complex regulatory network of sRNAs controlling flagella synthesis.
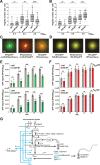
(A) Reduction in flagella number in motR-M1 mutant. (B) Increase in flagella number in fliX-M1 mutant. (C) Reduced motility in motR-M1 mutant (GSO1087) based on a competition assay with its corresponding WT (GSO1088). (D) No difference in motility in fliX-M1 mutant (GSO1076) based on a competition assay with its corresponding WT (GSO983). (E) Reduction in PflgB-gfp and PfliL-gfp expression in motR-M1 mutant (GSO1087) background compared to WT background (GSO1088). (F) No difference in PflgB-gfp and PfliL-gfp expression in fliX-M1 mutant (GSO1076) background compared to WT background (GSO983). (G) σ28-dependent sRNAs control flagella synthesis at different levels. UhpU activates the flagellar regulon by repressing a regulator of flhDC. MotR and FliX, respectively, activate and repress middle and the late gene expression (dotted line indicates exact mechanism is not known, although we document base pairing with the fliC mRNA). MotR and FliX also connect ribosome and flagella synthesis by regulating genes in the S10 operon (solid line indicates documented base pairing with this mRNA). In (A) and (B), the number of flagella per cell detected by EM were counted for 40 cells (black dots) for the motR-M1 (GSO1087) and its corresponding WT (GSO1088), and for fliX-M1 (GSO1076) and its corresponding WT (GSO983), strains at three points in growth (OD600 ~0.2, OD600 ~0.6, and OD600 ~2.0). A one-way ANOVA comparison was performed to calculate the significance of the change in flagella number (ns = not significant, **=p < 0.01, ***=p < 0.001, ****=p < 0.0001). Each experiment was repeated three times and one representative experiment is shown. Box plot and error bars descriptions as in Figure 2. For (C) and (D), WT or the corresponding mutant, expressed either green fluorescent signal or red fluorescent signal by carrying pCON1.proC-GFP or pCON1.proC-mCherry plasmid, respectively. In the left images, WT cells expressing GFP were mixed with mutant cells expressing mCherry; in the middle images, WT cells expressing mCherry were mixed with mutant cells expressing GFP; in the right images, WT cells expressing GFP were mixed with WT cells expressing mCherry. The indicated mixed cultures were spotted on a soft agar (0.3%) plate, incubated at 30 °C, and imaged after 18 hr. The scale given in (C) is the same for all motility plates. For (E) and (F), three biological repeats are shown in the graph (except for PfliL-gfp in fliX-M1, for which two repeats are shown). One-way ANOVA comparison was performed to calculate the significance of the change in GFP signal (ns = not significant, **=p < 0.01, ***=p < 0.001, ****=p < 0.0001).
Figure 8—figure supplement 1.
Figure 8—figure supplement 1.. Effects of chromosomal motR-M1 and fliX-M1 mutations.
(A) Northern blot analysis of total RNA from WT (GSO1088), and motR-M1 (GSO1087) cells grown to OD600~1.0. The levels of MotR-M1 expressed from the chromosome are comparable to those of WT MotR. Membranes were probed for MotR and then for 5S RNA as a loading control. (B) Northern blot analysis of total RNA from WT (GSO983), and fliX-M1 (GSO1076) cells grown to OD600~1.0. The levels of full-length FliX-M1 expressed from the chromosome are lower than WT FliX. Membranes were probed for FliX and then for 5S RNA as a loading control. (C) Reduced motility in motR-M1 mutant (GSO1087) compared to corresponding WT strain (GSO1088) based on motility assays with 0.3% agar. (D) No change in motility of fliX-M1 mutant (GSO1076) compared to corresponding WT strain (GSO983) based on motility assays with 0.3% agar. (E) Reduced FlgJ-SPA levels in a motR-M1 mutant. SPA-tagged FlgJ levels across growth in WT (GSO1081) and in motR-M1 mutant (GSO1082) were monitored. (F) Slightly increased in FlgJ-SPA levels in a fliX-M1 mutant. SPA-tagged FlgJ levels across growth in WT (GSO1080) and in fliX-M1 mutant (GSO1083) were monitored. Northern blot analysis showing (G) delayed expression of fliC mRNA in motR-M1 background and (H) advanced expression in fliX-M1 background. Graphs in (C) and (D) show the average of nine biological replicates, and error bars represent one SD. One-way ANOVA comparison was performed to calculate the significance of the change in motility (ns = not significant, ***=p < 0.0001). In (E) and (F), FlgJ-SPA levels were determined by immunoblot analysis using α-FLAG antibody. The Ponceau S-stained membrane serves as a loading control. In (G) and (H), fliC mRNA levels were determined by northern analysis as in Figure 4. RNA was separated on an acrylamide gel and probed for fliC and then for the 5S RNA as a loading control.
Figure 8—figure supplement 2.
Figure 8—figure supplement 2.. Conservation of σ28-dependent sRNAs.
σ28-dependent sRNAs sequences were examined for their conservation across the Gammaproteobacteria, revealing conservation in closely-related Enterobacteriaceael organisms. Sequences from representative bacterial species are aligned as follows. Gammaproteobacteria genomes were downloaded from PATRIC database (Davis et al., 2020) and searched for the query sRNAs using BLAST (Altschul et al., 1990), filtering for matches with at least 80% identity over 80% of the query sRNA sequence. Genomes containing each sRNA were marked as so on a text file. The process was written as a Nextflow pipeline (Di Tommaso et al., 2017) and is available on github: https://github.com/asafpr/sRNA_finder(Peer, 2021). The analysis results were confirmed by aligning the sRNAs sequences to representative Gamma proteobacteria species. The uhpT and flhC stop codons are indicated in lower case. Regions highlighted in blue reflect the suggested seed sequences (Melamed et al., 2016) and the regions that base pair with the targets tested in this study for uhpU, motR and fliX. The uhpU-S and fliX-S sequences are underlined. Nucleotides that differ from the E. coli MG1655 sequence are indicated in red. The abbreviations in the figure represent the following species: Escherichia coli MG1655 (E. coli MG1655), Escherichia coli O127:H6 (EPEC), Escherichia coli O157:H7 (EHEC), Salmonella enterica serovar typhimurium (S. typhimurium), Shigella flexneri (S. flexneri), Enterobacter hormaechei (E. hormaechei), and Citrobacter youngae (C. youngae). S. typhimurium and C. youngae are missing from the alignment for FliX as the fliX region was missing in these species.

Update of

  • doi: 10.1101/2021.08.05.455139
  • doi: 10.7554/eLife.87151.1
  • doi: 10.7554/eLife.87151.2

Similar articles

Cited by

References

    1. Adams PP, Flores Avile C, Popitsch N, Bilusic I, Schroeder R, Lybecker M, Jewett MW. In vivo expression technology and 5’ end mapping of the Borrelia burgdorferi transcriptome identify novel RNAs expressed during mammalian infection. Nucleic Acids Research. 2017;45:775–792. doi: 10.1093/nar/gkw1180. - DOI - PMC - PubMed
    1. Adams PP, Storz G. Prevalence of small base-pairing RNAs derived from diverse genomic loci. Biochimica et Biophysica Acta. Gene Regulatory Mechanisms. 2020;1863:194524. doi: 10.1016/j.bbagrm.2020.194524. - DOI - PMC - PubMed
    1. Adler J, Templeton B. The effect of environmental conditions on the motility of Escherichia coli. Journal of General Microbiology. 1967;46:175–184. doi: 10.1099/00221287-46-2-175. - DOI - PubMed
    1. Altegoer F, Bange G. Undiscovered regions on the molecular landscape of flagellar assembly. Current Opinion in Microbiology. 2015;28:98–105. doi: 10.1016/j.mib.2015.08.011. - DOI - PubMed
    1. Altschul SF, Gish W, Miller W, Myers EW, Lipman DJ. Basic local alignment search tool. Journal of Molecular Biology. 1990;215:403–410. doi: 10.1016/S0022-2836(05)80360-2. - DOI - PubMed

Publication types

MeSH terms

Associated data

LinkOut - more resources