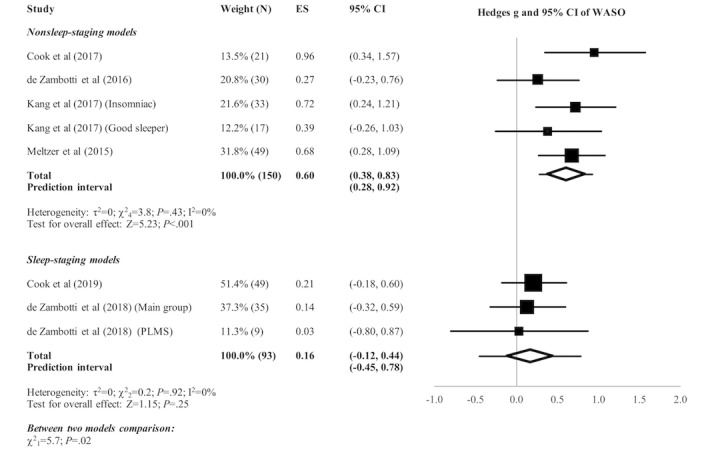
Figure 3.

Forest plot of the standardized mean difference (Hedges g) between Fitbit and polysomnography for the variable of wake after sleep onset (WASO). Results are shown as effect size (ES) and 95% CI. The difference in symbol size indicates the difference in the weight of the respective studies. The diamond symbol shows the 95% CI of the overall effect and the tails show the 95% prediction interval of the overall effect. PLMS: periodic limb movement in sleep.
