Abstract
Tumours progress despite being infiltrated by tumour-specific effector T cells1. Tumours contain areas of cellular necrosis, which is associated with poor survival in a variety of cancers2. Here, we show that necrosis releases an intracellular ion, potassium, into the extracellular fluid of mouse and human tumours causing profound suppression of T cell effector function. We find that elevations in the extracellular potassium concentration [K+]e act to impair T cell receptor (TCR)-driven Akt-mTOR phosphorylation and effector programmes, this potassium-mediated suppression of Akt-mTOR signalling and T cell function is dependent upon the activity of the serine/threonine phosphatase PP2A3,4. While the suppressive effect mediated by elevated [K+]e is independent of changes in plasma membrane potential (Vm), it does require an increase in intracellular potassium ([K+]i). Concordantly, ionic reprogramming of tumour-specific T cells through overexpression of the potassium channel Kv1.3 lowers [K+]i and improves effector functions in vitro and in vivo. Consequently, Kv1.3 T cell overexpression enhances tumour clearance and survival of melanoma-bearing mice. These results uncover a previously undescribed ionic checkpoint blocking T cell function within tumours and identify new strategies for cancer immunotherapy.
The tumour microenvironment is characterized in part by rapidly dividing cancer cells competing for limited local resources5,6. These factors cause dense areas of cellular apoptosis and necrosis 2. Tumour necrosis is frequently associated with a poor prognosis2, an observation thought to be an epiphenomenon of aggressive underlying cancer biology. However, cellular necrosis is also known to alter the extracellular milieu and has been associated with the release of intracellular ions7 8. While tumour-specific T lymphocytes harbour reactivity against tumour antigens9, their function is often suppressed within tumours1. Whether local necrosis or consequent ionic derangement contributes to T cell dysfunction within tumours is unknown.
Multiple lines of investigation have demonstrated that intact ion transport is required for T cell function. Germline ablation of store-operated Ca2+efflux (SOCE) results in severe combined immunodeficiency (SCID) in humans10. Moreover, voltage-gated Ca2+ channels are essential for T cell function and survival11 and mutations in the Mg2+ channel MAGT1 lead to human T cell immunodeficiency12. Moreover, overabundance of Na+ and Cl- promotes T cell pathogenicity and autoimmunity via the kinase SGK-113. Despite ions playing a key role in T cell function, their extracellular concentrations and consequence within tumours are poorly characterised.
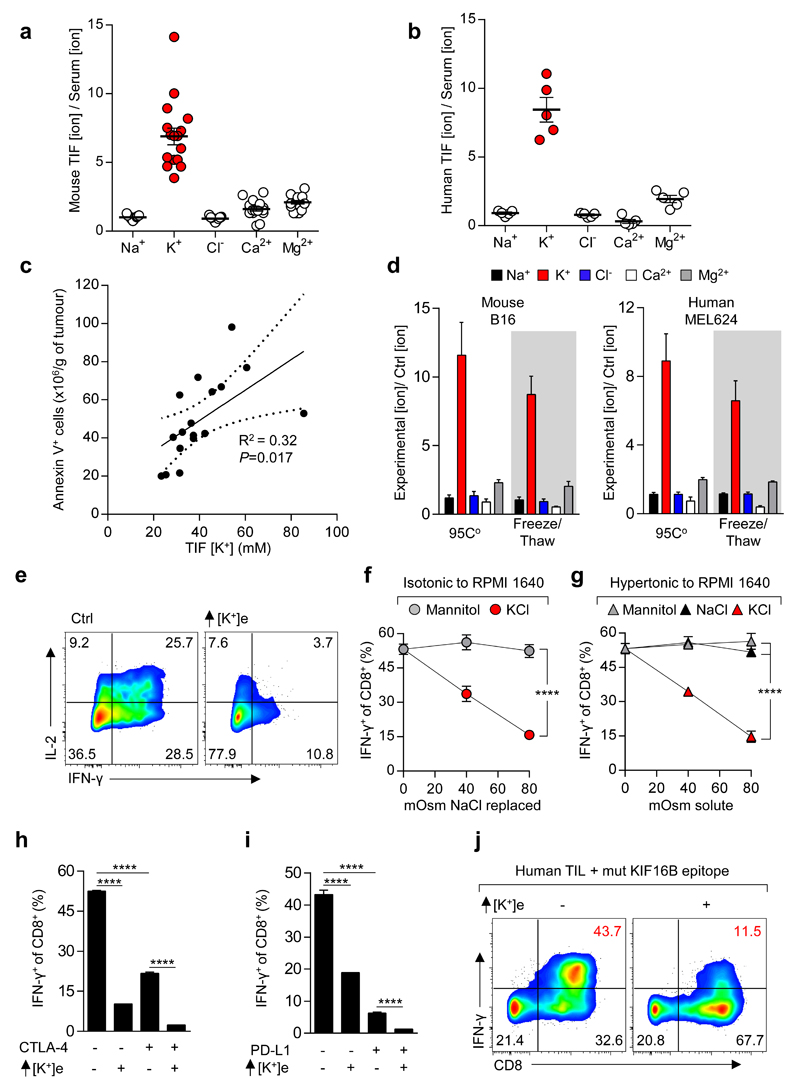
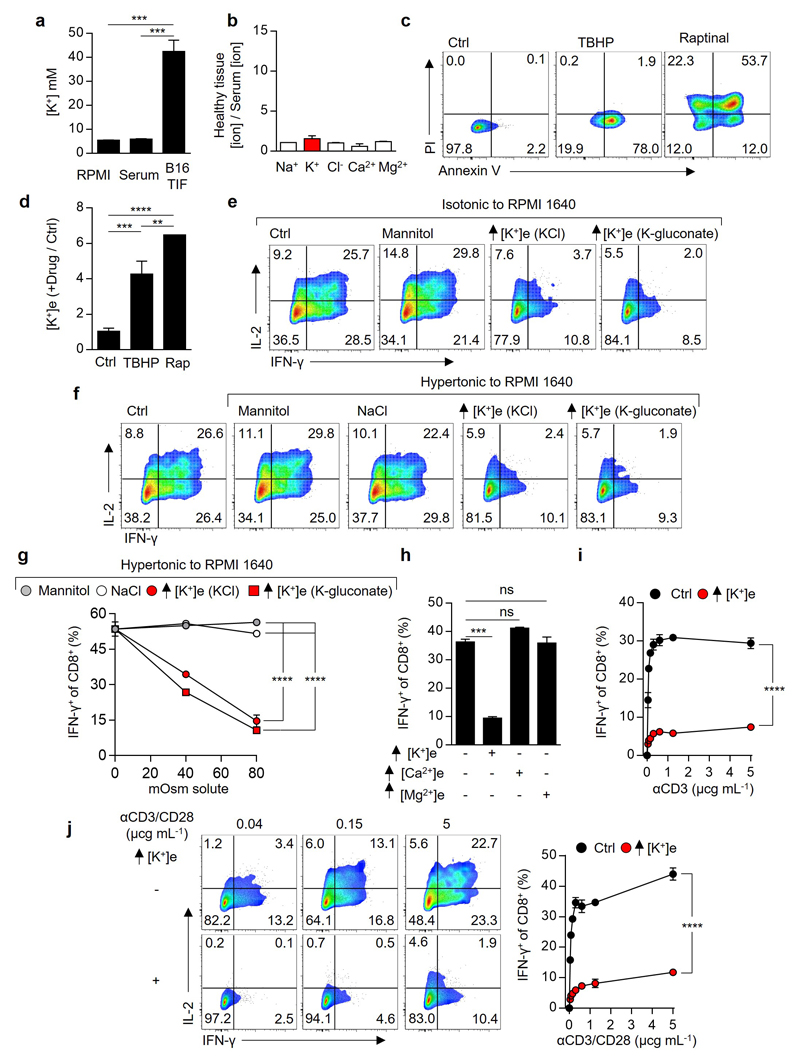
We hypothesized that tumour cell death leads to a local ionic imbalance within the tumour microenvironment. To isolate native undiluted extracellular fluid within tumours, hereinafter tumour interstitial fluid (TIF), we utilized a centrifugation method14 as previously described6,15. This enabled us to compare the concentration of 5 principal ions within TIF of murine B16 melanoma or human tumours to that within serum. The concentration of potassium ([K+]) in TIF was elevated compared to serum within both murine and human tumours (Fig. 1a,b and Extended Data 1a) but not in extracellular fluid isolated from healthy tissues (Extended Data 1b). We also observed a correlation between TIF [K+] and the density of dying cells within murine B16 tumours (Fig. 1c). Additionally, experimental induction of cell death or apoptosis in tumour-derived cell lines increased extracellular potassium concentration ([K+]e) (Fig. 1d and Extended Data 1c,d). Thus, we conclude that the extracellular space within tumours contains elevated [K+]e that is associated with local cellular apoptosis and necrosis.
Figure 1. Elevated [K+] within tumour interstitial fluid (TIF) silences the TCR induced anti-tumour function of mouse and human T cells.
(a-b) Ratiometric representation of TIF to serum values for the indicated ions from mouse (a) and human (b) tumour tissue. (c) Linear regression and 95% CI best fit line representing the relationship between TIF [K+] and Annexin V+ cells per gram of tumour. Significance calculated by Pearson’s correlation coefficient. (d) Extracellular concentration of electrolytes following induction of cell death as indicated for mouse (left) and human (right) tumour cell lines. (e-i) Anti-CD3/28 based activation of CD8+ mouse T cells in the indicated conditions with representative flow cytometry, additional [K+]e equal to 40mM unless otherwise indicated (e) and quantification (f-i). (j) Human TIL stimulated in the indicated conditions with mutated (mut) neo-antigen peptide pulsed target cells (autologous B-cells), additional [K+]e equal to 50 mM . Error bars represent mean ± SEM. *P < 0.05; **P< 0.01 ***P < 0.001; ****P < 0.0001 between selected relevant comparisons, (f,g) 2-way ANOVA, (h,i) 2-tailed Student’s t tests. (a,c) eighteen biological replicates (b) five biological replicates (d) four culture replicates (e-i) three culture replicates per condition (j) three culture replicates. Representative of (e-g) three (h,i,j) two independent experiments.
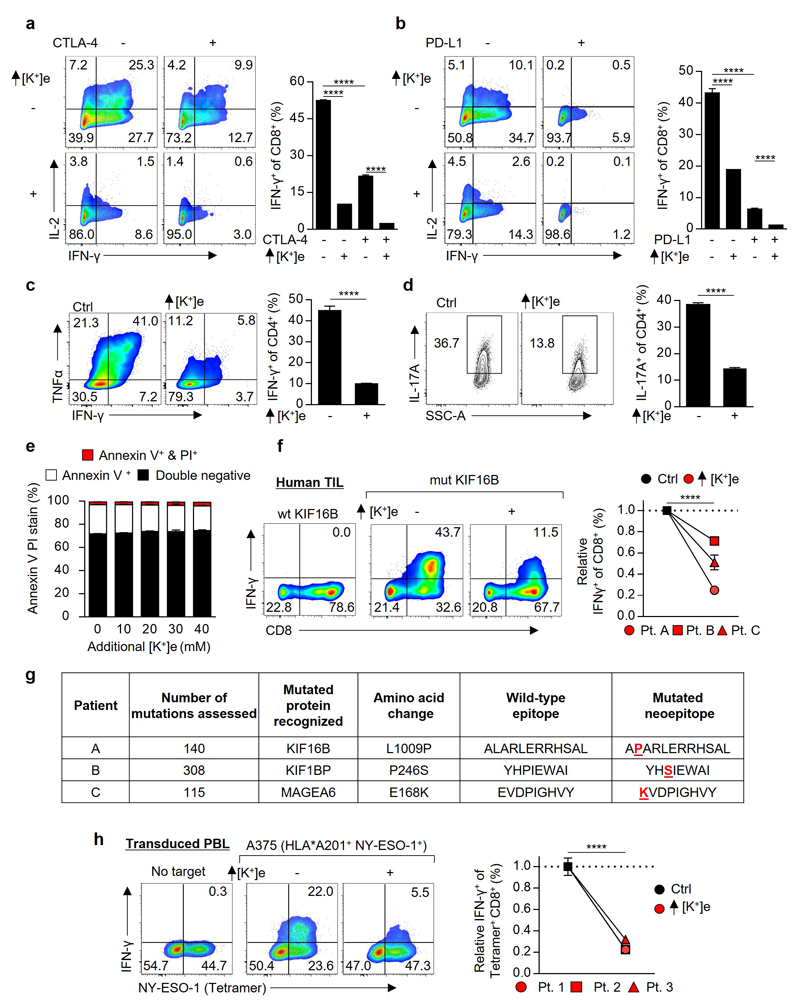
We next asked whether elevated [K+]e affects T cell function. We found a striking dose-dependent suppression of TCR-induced cytokine production by isotonic elevations in [K+]e (Fig. 1e,f). Elevated [K+]e acted independent of tonicity, with other monovalent and divalent ions or inert osmolytes failing to induce similar suppression (Fig 1f,g and Extended Data 1e-h). Elevated [K+]e functioned to acutely suppress T cell activation across a range of signal strengths (Extended Data 1i), in the presence or absence of co-stimulation (Extended Data 1j), in a non-redundant fashion to tumour-associated co-inhibitory signals (Fig. 1h,i and Extended Data 2a-b), in CD4+ TH1 and TH17 effector subtypes (Extended Data 2c,d), and had no effect on cellular viability (Extended Data 2e). We next isolated endogenous human neoantigen-specific TIL, identified as likely mediators of immunotherapy-induced tumour clearance9,16, and found IFN-γ production by these cells in response to their cognate neoepitope to be significantly attenuated by elevated [K+]e (Fig. 1j and Extended Data 2f,g). Elevated [K+]e also led to suppression of target-specific IFN-γ production by T cells genetically engineered with a cancer-germline antigen specific TCR17(Extended Data 2h). Thus, our data suggests that elevated [K+]e acutely limits the function of mouse and human T cells.
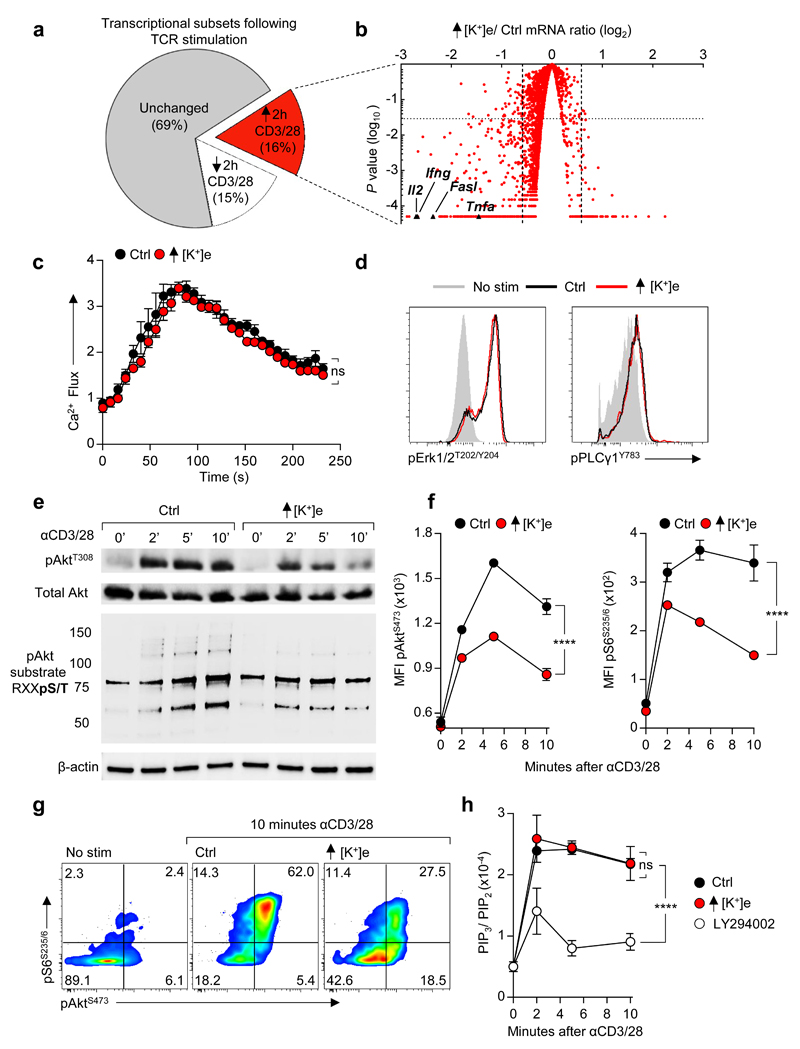
To understand the basis for this suppression of effector function, we explored the effect of elevated [K+]e on the molecular events driven by TCR engagement. To this end, we briefly activated FACS-purified murine CD8+ T cells in the presence or absence of elevated potassium and found that elevated [K+]e significantly restrained the expression of transcripts induced by TCR stimulation (Fig. 2a,b). Furthermore, gene-set enrichment analysis indicated that elevated [K+]e suppressed genes induced by TCR signalling, NF-κB activation, escape from anergy, adaptive immune response, and cytokine pathways (Supplementary Information 1). Collectively, these data suggest that intratumoural cell death produces elevated [K+]e concentrations which act to suppress TCR-driven effector programmes.
Figure 2. Extracellular potassium inhibits TCR induced transcripts and function by suppressing Akt-mTOR phosphorylation.
(a) Pie chart representing proportional subpopulations of all transcripts following 2h re-stimulation of purified CD8+ T cells with anti-CD3/28 (b) Volcano plot of TCR induced genes briefly re-stimulated with anti CD3/28 in the indicated conditions. (c) TCR cross-linking induced calcium flux of CD8+ cells as measured by Fluo3 / FuraRed fluorescence in the indicated conditions. (d) Representative phosflow cytometry plots following TCR cross-linking in the indicated conditions. (e) Immunoblot analysis of the indicated phospho-residues in CD8+ T cells following TCR cross-linking (f) Quantitative phosflow analysis of cells activated as in (c) and (d) with representative flow cytometry in (g). (h) Quantification of the indicated phosphotidylinositol species in CD8+ T cells activated via TCR cross-linking in the indicated conditions. Error bars represent mean ± SEM. *P < 0.05; **P< 0.01 ***P < 0.001; ****P < 0.0001 between selected relevant comparisons, 2-way ANOVA, (c-h) where noted additional [K+]e equal to 40mM (a,b,c) three biological replicates (d,f) three technical replicates per data point (h) three experimental replicates with pooled analysis displayed, (d-g) representative of at least three independent experiments.
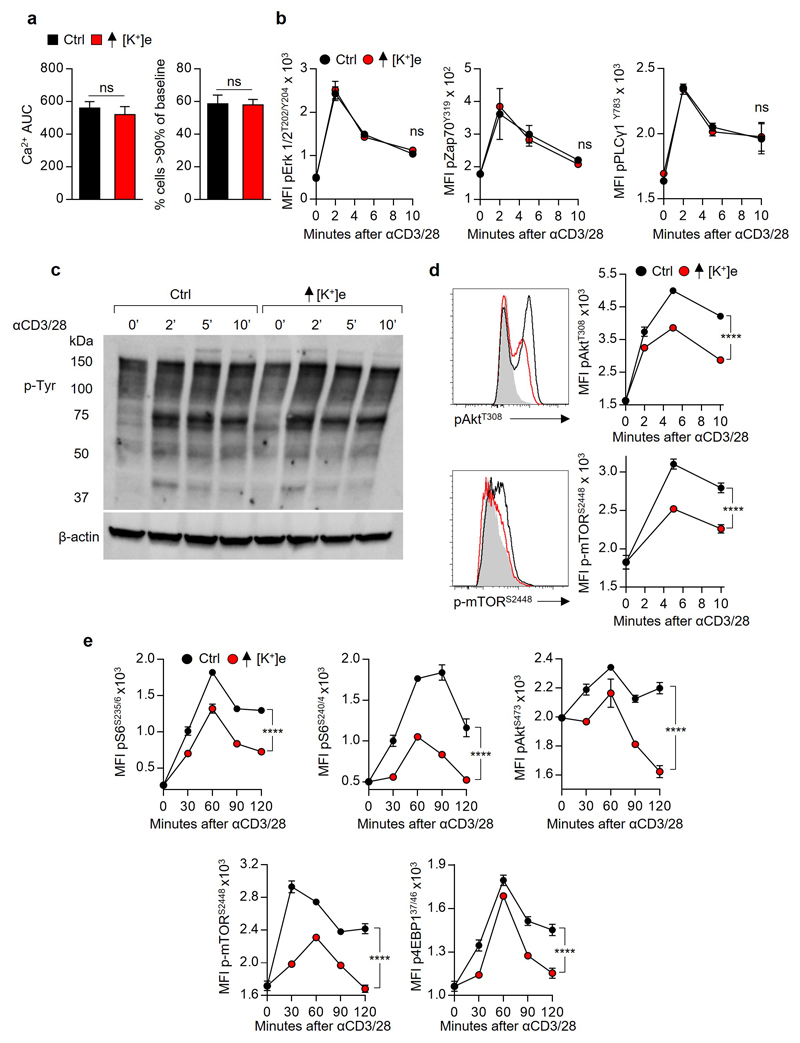
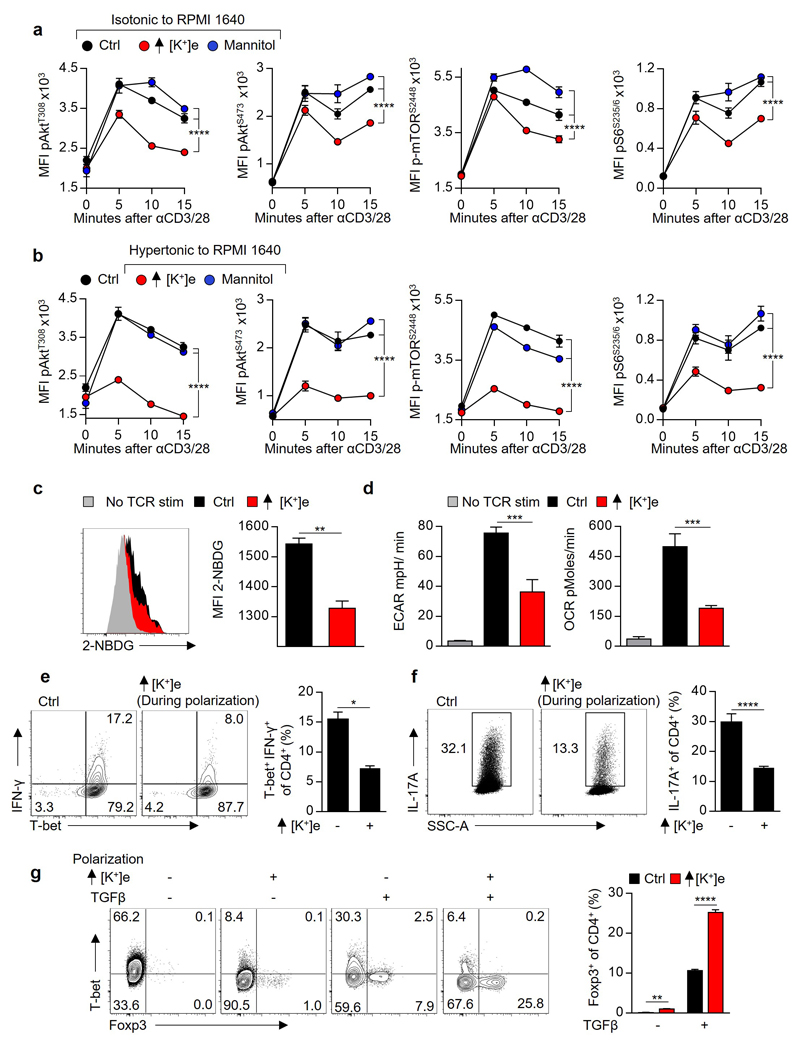
The observation that elevated [K+]e acutely suppressed TCR-driven transcriptional events led us to ask whether [K+]e could affect TCR-induced signal transduction pathways. Given the role of [K+]e in regulating plasma membrane potential18,19, we initially hypothesized that K+ acted to suppress TCR activation via induction of cellular membrane depolarization (increased Vm) with subsequent dissipation of the electromotive force driving Ca2+ entry. However, we could not detect any changes in TCR-induced Ca2+ flux in the presence of isotonic elevations in [K+]e employed in our experiments (40mM) (Fig. 2c and Extended Data 3a). Additionally, elevated [K+]e did not affect the phosphorylation of Zap70, Erk1/2, PLCγ1, or global tyrosine phosphorylation following TCR ligation (Fig. 2d and Extended Data 3b-c). However, elevated [K+]e did reduce TCR-induced phosphorylation of Akt and serine/threonine residues targeted by Akt (Fig. 2e-g and Extended Data 3d), including mTOR and the ribosomal protein S6 (Fig. 2f,g and Extended Data 3d). Suppression of Akt-mTOR signalling by elevated [K+]e was appreciable at later time points (Extended Data 3e), not recapitulated by other osmolytes (Extended Data 4a), and apparent in conditions of hypertonic hyperkalaemia (Extended Data 4b). Consistent with a role in limiting Akt-mTOR activity20, elevated [K+]e inhibited TCR-induced nutrient consumption, (Extended Data 4c,d), CD4+ polarization to effector-lineages (Extended Data 4e,f), and promoted the induction of Foxp3+ CD4+ T cells (Extended Data 4g). Taken together, we conclude that elevated [K+]e limits TCR-driven effector function via suppression of the Akt-mTOR pathway.
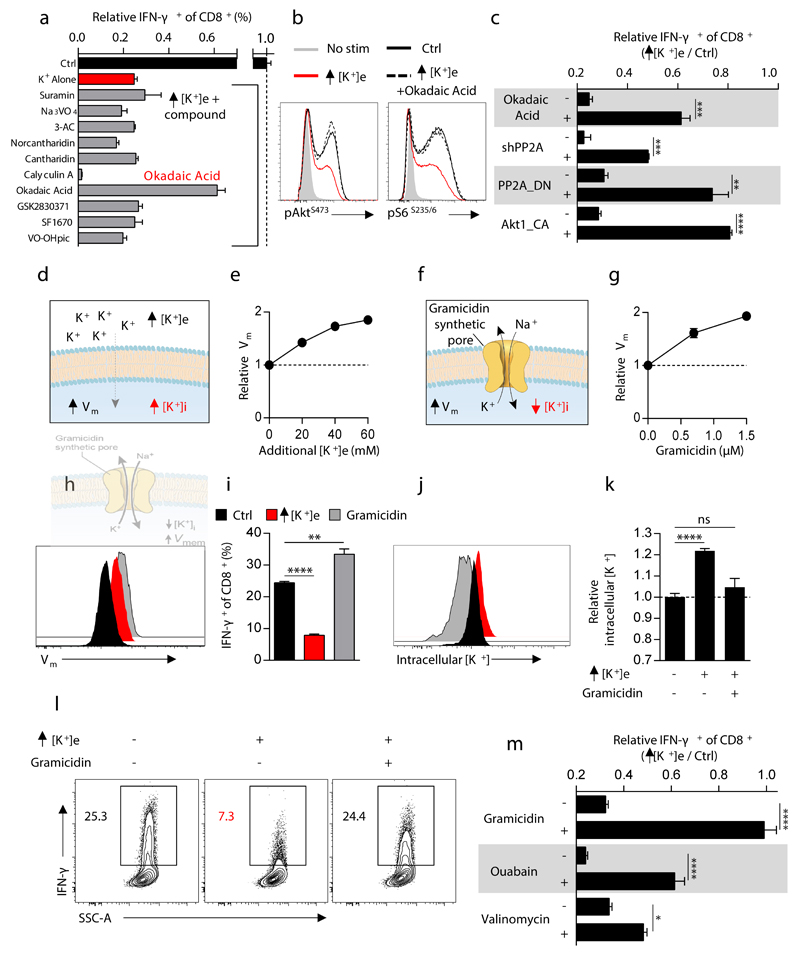
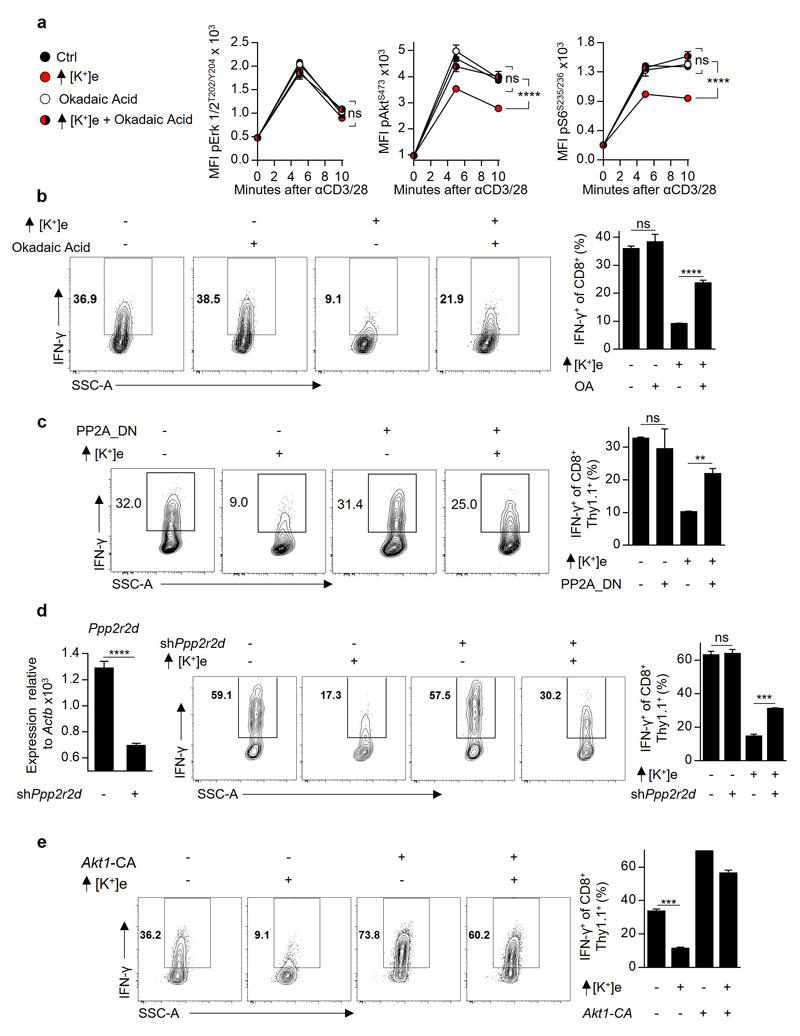
We next aimed to determine how elevated [K+]e suppresses TCR-induced Akt-mTOR phosphorylation. First, we hypothesised that elevated [K+]e inhibits PI3K activity. However, elevated [K+]e had no effect on TCR-induced PIP3 accumulation, (Fig. 2h), indicating that K+-mediated suppression of Akt signalling was downstream of PI3K activation. Regulation of Akt activity downstream of PI3K is carried out, in part, by serine/threonine phosphatases. To interrogate cytokine production in the presence of elevated [K+]e we used a pharmacologic screening approach to determine whether selected compounds, including inhibitors of cellular phosphatases, might restore effector function in the presence of elevated [K+]e. Phosphatase-inhibitors contained within the screen are depicted in Fig. 3a. Notably, okadaic acid (OA), an inhibitor of the serine/threonine phosphatase PP2A21, significantly restored T cell function in the presence of elevated [K+]e.
Figure 3. Extracellular potassium mediated T cell suppression requires intact PP2A activity and is associated with elevations in intracellular potassium.
(a) Selected phosphatase inhibitors from a pharmacologic screen for IFN-γ production of CD8+ T cells in the presence of elevated [K+]e, depicted as the ratio of IFN-γ expression in Ctrl / elevated [K+]e conditions in the presence of indicated phosphatase inhibitors (b) CD8+ T cell phosphorylation of pAktS473 and pS6S235/6 10 minutes following TCR cross-linking in the indicated conditions. (c) Compiled analysis of IFN-γ production by retrovirally transduced CD8+ Thy1.1+ T cells following TCR stimulation in the indicated conditions. (d) Pictorial representation of the resultant intracellular changes in plasma membrane potential (Vm) and intracellular potassium concentration ([K+]i) in the presence of elevated extracellular potassium ([K+]e). (e) Relative cytoplasmic Vm of CD8+ T cells in the indicated conditions represented as relative fluorescence of the voltage-sensitive fluorescent indicator DiSBAC4(3). (f) Pictorial representation of the resultant intracellular changes in plasma membrane potential (Vm) and intracellular potassium concentration ([K+]i) in the presence of the ionophore gramicidin. (g) Relative cytoplasmic Vm of CD8+ T cells in the indicated conditions assayed as in (e) with representative flow cytometry in (h). (i) IFN-γ production by CD8+ T cells following TCR induced stimulation in the indicated conditions. (j) Representative flow cytometry representing [K+]i of CD8+ T cells as relative fluorescence of the potassium sensitive dye Asante-Green 4. (k) Relative [K+]i of CD8+ T cells in the indicated conditions assayed as relative fluorescence of the potassium sensitive dye Asante-Green 4. (l) Representative flow cytometry of cytokine expression by CD8+ T cells following TCR stimulation in the indicated conditions with compiled quantification in (m). Error bars represent mean ± SEM. *P < 0.05; **P< 0.01 ***P < 0.001; ****P < 0.0001 between selected relevant comparisons, 2-tailed Student’s t tests (a-m), where noted additional [K+]e equal to 40mM, (a,c,i,l,m) at least three culture replicates per data point (e,g,h,j,k) three technical replicates per data point, representative of at least (a,b,c,m) two or (e,g,i,h,l,k) three or greater independent experiments.
Moreover, OA reversed the hypophosphorylation of Akt and S6 caused by elevated [K+]e (Fig. 3b and Extended Data 5a) in addition to restoring effector function (Fig. 3c and Extended Data 5b). Similarly, genetic disruption of PP2A function, via overexpression of a dominant negative isoform (PP2A_DN) or by short-hairpin mediated RNA interference against the PP2A subunit Ppp2r2d similarly rescued effector function in the presence of elevated [K+]e (Fig. 3c, Extended Data. 5c and 5d). Consistent with the mechanistic involvement of Akt-mTOR hypophosphorylation in the suppression of effector function mediated by elevated [K+]e, we found that T cells expressing a constitutively active form of Akt (Akt1-CA) exhibited resistance to the inhibitory effects of high [K+]e (Fig. 3c and Extended Data 5e). Thus, we conclude that elevations in [K+]e drive hypophosphorylation of the Akt-mTOR pathway in a PP2A-dependent manner.
We next aimed to determine the intracellular changes responsible for decreased Akt-mTOR phosphorylation and cytokine production in the presence of elevated [K+]e.
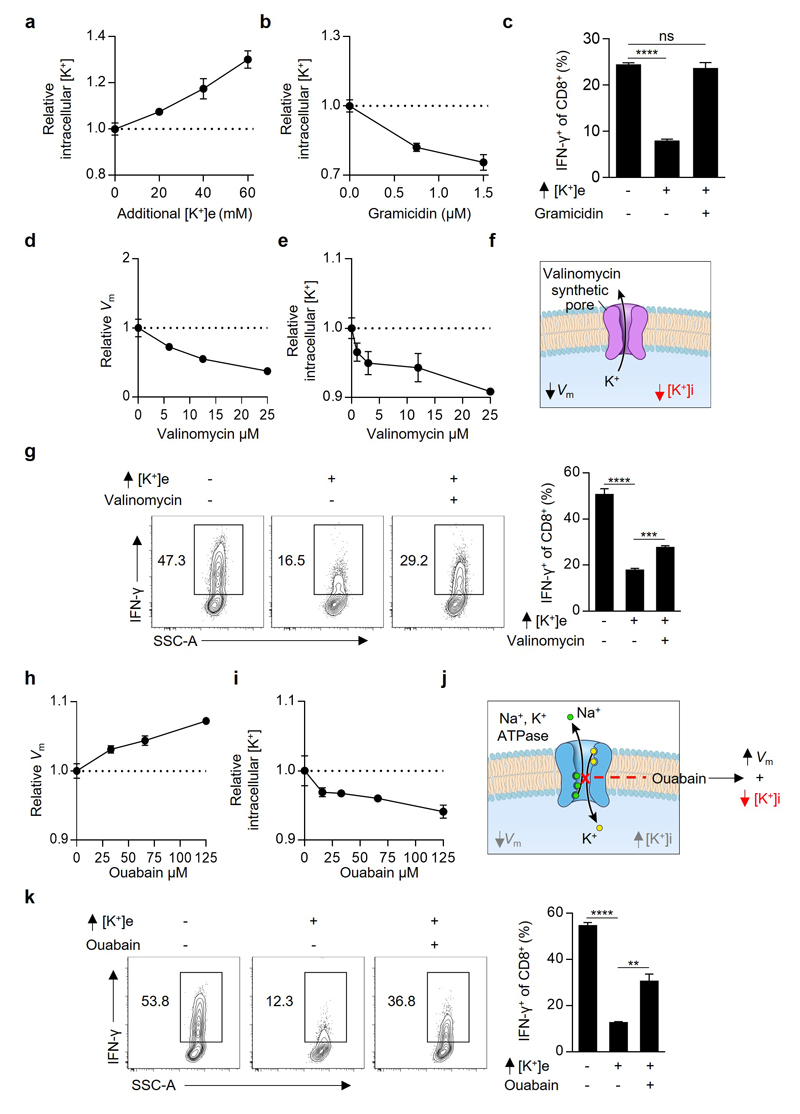
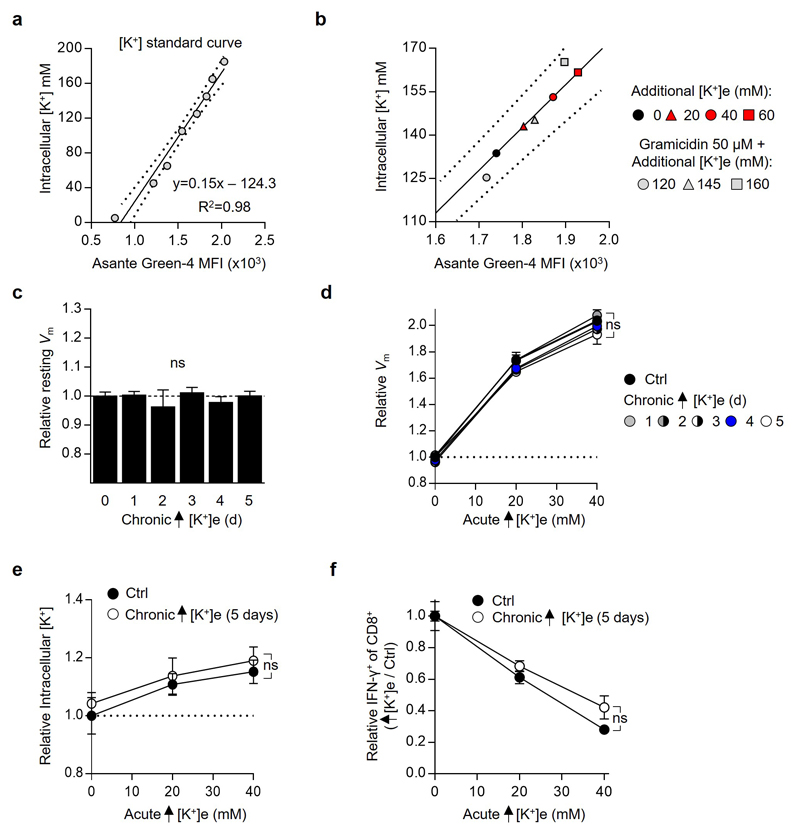
As potassium is the principal determinant of resting plasma membrane potential (Vm)18,19, we first asked whether increased Vm in the presence of elevated [K+]e provided the source of T cell suppression (Fig. 3d,e). To this end we tested whether modulation of Vm by other means in the presence of low [K+]e would result in analogous suppression of T cell function. We treated cells with the ionophore gramicidin, which increases Vm by forming pores in the plasma membrane permeable to both sodium and potassium (Fig. 3f-h). However, as gramicidin, in contrast to elevated [K+]e, increased IFN-γ production (Fig. 3i), we reasoned that suppression of T cell function by high [K+]e is independent of its effect on Vm and rather depends upon the concentration of intracellular potassium ([K+]i). Consistent with this hypothesis, elevated [K+]e raised [K+]i while gramicidin depleted [K+]i and reversed the suppressive effect induced by high [K+]e (Fig. 3j-m and Extended Data 6a-c). Additionally, other pharmacologic conditions that depleted intracellular K+ led to rescue of T cell function in the presence of elevated [K+]e (Fig. 3m and Extended Data 6d-k). Consistent with results in other cell types, we quantified the baseline [K+]i of T cells as 133.8 mM±3.3. Additions of 20 to 40 mM [K+]e increased [K+]i to 143 mM±4.5 and 153.2 mM±4.4, respectively (Extended Data 7a,b). While T cells chronically exposed to elevated [K+]e responded similarly to subsequent [K+]e changes as those cultured in control conditions (Extended Data 7c-f), brief exposure to ouabain, a pharmacologic agent that inhibits the Na+, K+ - ATPase, partially reversed elevations in [K+]i and T cell suppression in the presence of high [K+]e (Fig. 3m and Extended Data 6h-k). Taken together, these data suggest that elevated [K+]i in the presence of elevated extracellular concentrations may result from a combination of augmented Na+, K+ - ATPase function and a relative decrease in potassium ion flow per channel as the dynamically equilibrated chemical gradient between the intracellular and extracellular space, and the absolute reversal potential for potassium, is attenuated.
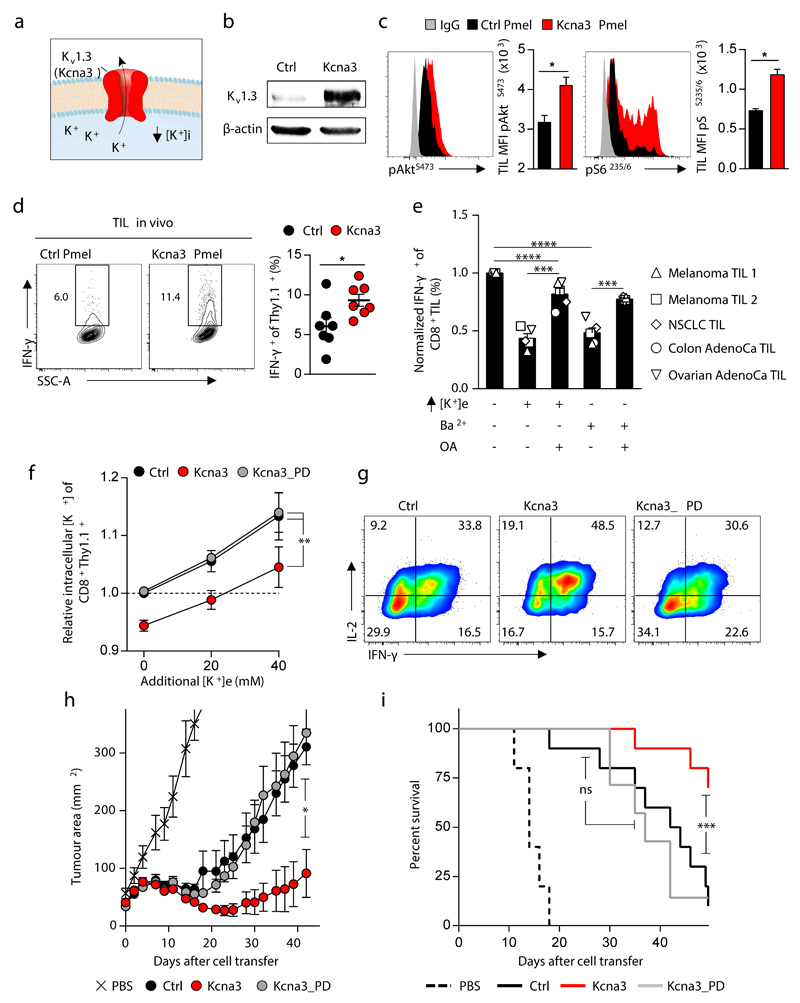
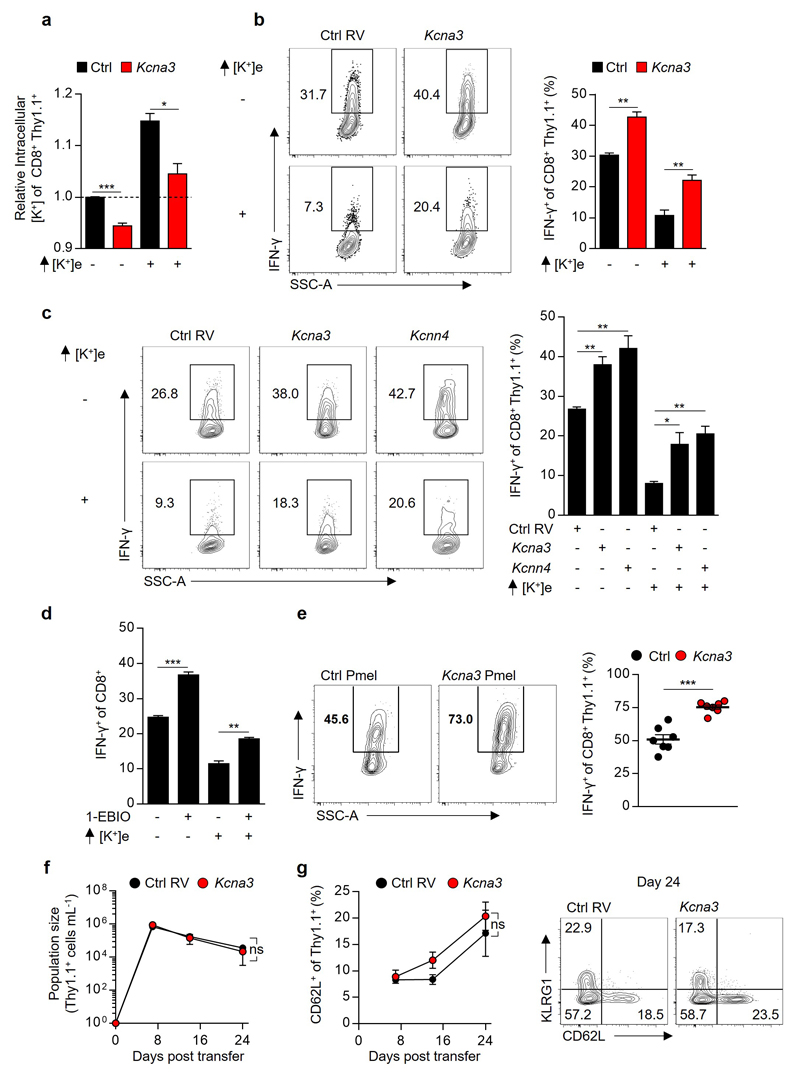
Collectively, our findings suggested that enhancing T cell potassium efflux might increase T cell anti-tumour function. Prior investigations of T cell-intrinsic potassium transport, focusing on the voltage-gated potassium channel Kv1.3 (Kcna3) and the calcium-gated potassium channel KCa3.1 (Kcnn4), have described dynamic regulation of potassium transport in association with T cell activation and differentiation state22,23. Brief re-stimulation of CD8+ effector cells in vitro (Fig. 2b) revealed acute upregulation of Kcna3 mRNA in addition to dynamic expression of transcripts encoding potassium channels, pumps, and regulatory subunits (Supplementary Information 2). Due to its TCR-induced expression and previously described role in T cell function24, we hypothesized that enforced expression of Kcna3 may increase potassium efflux with a resultant increase in intratumoural T cell effector function. Indeed, we found that overexpression of Kcna3 (Figure 4a,b) resulted in lower T cell [K+]i (Extended Data 8a) and imparted resistance to elevated [K+]e-mediated suppression (Extended Data 8b). Overexpression or pharmacologic activation of KCa3.1 produced a similar gain-of-function and resistance to K+ mediated suppression (Extended Data 8c-d).
Figure 4. Kcna3 mediated augmented K+ efflux lowers intracellular [K+], enhances Akt-mTOR signalling, and augments anti-tumour effector function to improve tumour clearance and host survival.
(a) Pictorial representation of the potassium channel Kv1.3 (Kcna3) (b) Representative immunoblot analysis of Kv1.3 protein abundance in CD8+ Pmel-1 cells following retroviral transduction with Ctrl (Empty-Thy1.1) or Kcna3-Thy1.1 constructs. (c,d) Thy1.1+ Pmel-1 CD45.1+CD8+ TIL 6-8 days following transfer into B16 melanoma-bearing mice were analysed for indicated phospho-residues (c) or in vivo IFN-γ production 6 hours after injection with Brefeldin A (d). (e) Relative cytokine expression of human TIL originating from the indicated histology following TCR stimulation in the indicated conditions. (f,g) Analysis of intracellular [K+] (f) and representative flow cytometry for the expression of the indicated cytokines (g) of CD8+ Thy1.1+ T cells following transduction with retrovirus expressing Ctrl, Kcna3, or Kcna3_PD Thy1.1+ constructs. (h,i) Rates of tumour growth (h) and host survival (i) represented over time following receipt of Pmel-1 CD8+ T cells transduced as in (f,g). 2-tailed Student’s t tests (c-e), 2-way ANOVA (f), Wilcox rank-sum analysis (h), and Log-rank of Kaplan-meier survival estimates (i). Error bars represent mean ± SEM. *P < 0.05; **P< 0.01 ***P < 0.001; ****P < 0.0001 between selected relevant comparisons, additional [K+]e equal to 50mM in (e). (c) five mice per group (d) seven mice per group (e) each symbol represents the mean of three culture replicates per patient per data point (f) three technical replicates per data point (h,i) at least ten mice per group, representative of (b) three, (c-i) two independent experiments.
To test whether augmented potassium efflux improved T cell function in vivo, we transferred TCR-transgenic Pmel-1 CD8+ T cells transduced with Kcna3, or a control retroviral construct, into B16 tumour-bearing mice. First, we noted that Kcna3 overexpression in TIL increased Akt-mTOR activation (Fig. 4c) and IFN-γ production within tumours (Fig. 4d) and following brief re-stimulation ex vivo (Extended Data 8e), without affecting T cell phenotype or number in response to viral infection (Extended Data 8f-g).
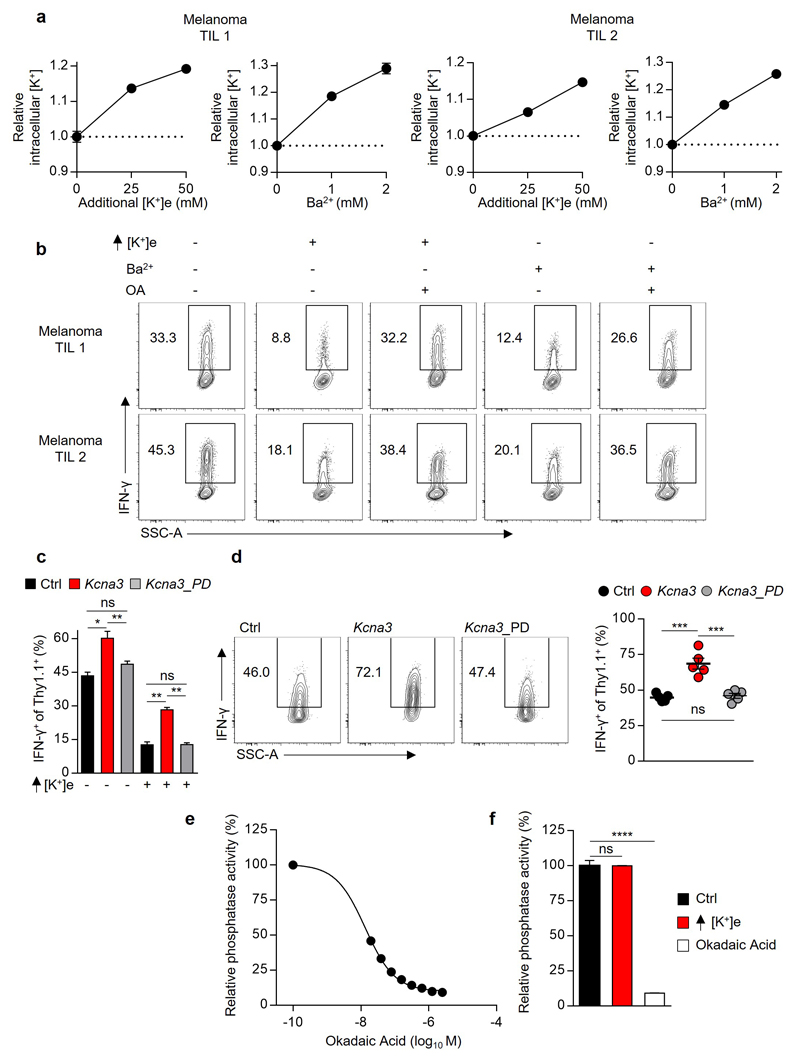
To extend our observations, we tested whether human TILs from multiple cancer types were supressed by elevated [K+]e, or alternative treatments that increase [K+]i, in a PP2A dependent manner. Consistently, we found that either elevated [K+]e or inhibition of endogenous potassium channels with Ba2+ increased [K+]i and suppressed effector function in a manner that also required intact PP2A function in human TILs (Fig. 4e and Extended Data 9a,b).
To test whether the gain-of-function observed as a result of Kcna3 overexpression resulted from increased ion transport, we generated a non-conducting “pore dead” construct (Kcna3_PD; W389F)25. Kcna3_PD failed to alter [K+]i, cytokine production in vitro (Fig. 4f,g and Extended Data 9c), or effector function of transduced TILs (Extended Data 9d). Moreover, only intact Kcna3 resulted in enhanced tumour clearance and host survival (Fig. 4h,i). Collectively, these results indicate that augmenting cellular potassium efflux can provide a means to increase the function of adoptively transferred T cells in tumours.
In this study, we have found that cell death within tumours is associated with elevated [K+]e at a level that leads to increased [K+]i within T cells, silencing of TCR-induced Akt-mTOR phosphorylation and decreased T cell effector function. While intact PP2A function was required for K+ mediated suppression of T cell function, K+ did not directly affect PP2A phosphatase activity (Extended Data 9e,f), implicating a functional intermediate. Interestingly, investigations into the function of PP2A have identified several endogenous small molecules and metabolites that can variably affect PP2A to increase or decrease its contextual function26,27. Future experiments will aim to define if [K+]i alters the processing, localization, or abundance of metabolites that affect PP2A activity. These findings may also shed light on prior observations that changes in [K+]i regulate inflammasome activation in macrophages28 and can control cellular peptide and phospholipid processing29,30.
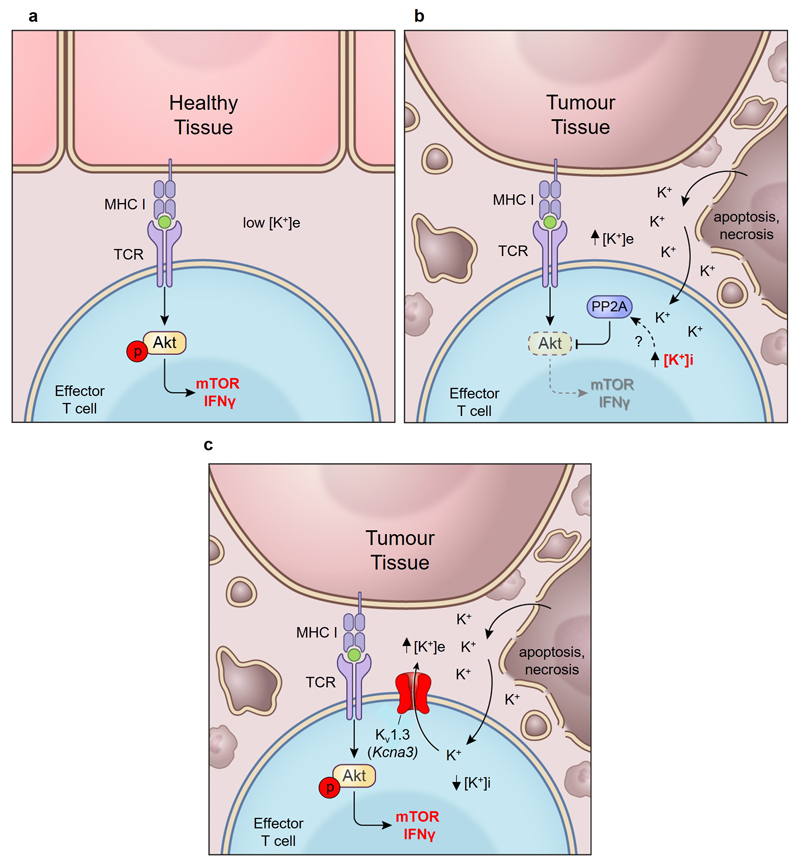
Finally, we found that elevated [K+]e suppresses T cell effector function and that anti-tumour T cells reprogrammed to express the potassium transporter Kcna3 exhibited lower [K+]i and mediated enhanced effector function in vitro and in vivo. These data identify a novel tumour-induced ionic checkpoint acting upon T cell effector function (Extended Data 10a-c) and that manipulating the intracellular ion concentration of anti-tumour T cells can augment disease clearance, with implications for immune-based therapies for cancer.
Materials & Methods (online)
Study Approval
Animal experiments were conducted with the approval of the NCI and NIAMS Animal Use and Care Committees. All NIH cancer patients providing human samples were enrolled in clinical trials approved by the NIH Clinical Center and NCI institutional review boards. Each patient signed an informed consent form and received a patient information form prior to participation
Mice and cell lines
Pmel-1 (B6.Cg-/Cy Tg [TcraTcrb] 8Rest/J), Rag2−/−, OT-II (B6.Cg-Tg (TcraTcrb)425Cbn/J), and C57BL/6 mice were obtained from the Jackson Laboratory. C57BL/6 male mice of 6-8 weeks of age were used as recipient hosts for adoptive transfer unless otherwise indicated. We crossed Pmel-1 with Ly5.1 mice (B6.SJL-PtprcaPepcb/BoyJ) to obtain Pmel-1 Ly5.1 mice. We crossed OT-II with Rag2-/- to obtain OT-II Rag-/- mice. All mice were maintained under specific pathogen–free conditions. B16 (H-2Db), a murine melanoma, transduced as previously described31 to express gp100 with human residues at position 25-27; EGS -> KVP. Mel624 was obtained from ATCC and Platinum-E ecotropic packaging cells were obtained from Cell Biolabs. Cell lines and maintained in DMEM media with 10% FBS, 1% glutamine and 1% penicillin-streptomycin.
Cell line authentication
Mel624 and Platinum-E cells were obtained from ATCC following authentication and validation as being mycoplasma free. Authenticated B16 was obtained from the National Cancer Institute Tumour Repository and validated as being mycoplasma free via a PCR based assay.
Statistical analysis
Data were compared using either a 2-tailed Student’s t test corrected for multiple comparisons by a Bonferroni adjustment or repeated measures 2-way ANOVA, as indicated. Where necessary, the Shapiro–Wilk test was used to test for normality of the underlying sample distribution. Experimental sample sizes were chosen using power calculations with preliminary experiments or were based on previous experience of variability in similar experiments. Samples that had undergone technical failure during processing were excluded from analyses. The Kolmogorov–Smirnov test was used to evaluate the significance between different distributions. For adoptive transfer experiments, recipient mice were randomized prior to cell transfer. The products of perpendicular tumor diameters were plotted as the mean ± SEM for each data point, and tumor treatment graphs were compared by using the Wilcoxon rank sum test and analysis of animal survival assessed using a log-rank test. In all cases, P values of less than 0.05 were considered significant. Statistics were calculated using GraphPad Prism 7 software (GraphPad Software Inc.).
Electrolyte analysis of serum and interstitial fluid
We utilized a previously reported method to isolate tissue interstitial fluid via a centrifugation method6,15,14. Briefly, en bloc tissue was harvested, placed on triple layered 10 µM nylon mesh, and spun at <50 g for 5 minutes to remove surface liquid. Next, samples were centrifuged at 400 g, a previously validated speed at which intracellular contents are not liberated15,14, for an additional 10 minutes. Flow through from this step was retained as interstitial fluid and assayed for indicated electrolyte concentrations in a blinded fashion within the NIH Central Clinical Chemistry Laboratory using auto analyzer (AA) ion selective electrode (ISE) quantification (Cobas 6000; US Diagnostics)32.
External Solution Formulations
Unless otherwise indicated, re-activation of cells in elevated concentrations of potassium ([K+]e) was performed with an isotonic RMPI formulation with an additional 40 mM of potassium for mouse cells and 50 mM for human cells in comparison to the control condition media. In principal this media was produced by obtaining a custom formulation of RPI 1640 from Gibco that was devoid of NaCl. For control conditions, this media was reconstituted with NaCl to produce a solution equimolar to standard RPMI. Thus, the final inorganic salt concentrations for the control condition was identical to that in RPMI 1640 (Gibco) in mM: NaCl 103.4, NaHC03 23.8, Na2PO4 5.6, KCl 5.3, MgSO4 0.4, Ca(NO3)2) 0.4. For isotonic media containing an additional 40 mM KCl, this media was reconstituted with a combination of NaCl and KCl such that the final inorganic salt concentrations, again in mM, were: NaCl 63.4, NaHC03 23.8, Na2PO4 5.6, KCl 45.3, MgSO4 0.4, Ca(NO3)2) 0.4. For 40 mM hypertonic NaCl the final inorganic salt concentrations were, in mM: NaCl 143.4, NaHC03 23.8, Na2PO4 5.6, KCl 5.3, MgSO4 0.4, Ca(NO3)2) 0.4. For 40 mM hypertonic KCl the final inorganic salt concentrations were, in mM: KCl 143.4, NaHC03 23.8, Na2HPO4 5.6, KCl 5.3, MgSO4 0.4, Ca(NO3)2) 0.4. All other additives in RPMI 1640 (Vitamins, amino acids, glutathione, phenol red, etc) were unchanged in quality or quantity.
T cell TCR-induced Ca2+ was carried out in a combination of NaCl deplete RPMI 1640 reconstituted with NaCl or KCl and HBSS with Ca2+ and Mg2+ and without phenol red (Gibco). As such, the final inorganic salt concentrations in control conditions were, in mM: NaCl 120.6, NaHC03 13.9, Na2PO4 2.9, KCl 5.3, MgSO4 0.4, Ca(NO3)2) 0.2, CaCl2 0.63, KH2PO4 0.22, MgCl2 0.25, and D-glucose 8.3 mM. While in the same experiment the concentration of inorganic salts, in mM, in the condition with elevated [K+]e were: NaCl 80.6, NaHC03 13.9, Na2PO4 2.9, KCl 45.3, MgSO4 0.4, Ca((NO3)2) 0.2, CaCl2 0.63, KH2PO4 0.22, MgCl2 0.25, D-glucose 8.3 mM. As this final solution was a combination of HBSS and RPMI 1640 it contained all of the non-inorganic salt additives (vitamins, amino acids, glutathione, phenol red) normally within standard RPMI 1640, as reported in the publically available Gibco formulation, at one-half of the original concentration.
Generation and activation of effector T cells
In vitro activation of T cells was carried out either by negative enrichment (Miltenyi) of CD8+ T cells from C57BL/6 mice followed by activation using using immobilized anti-CD3 (145-2C11; eBioscience) and anti-CD28 (37-51; eBioscience) along with expansion in culture medium containing IL-2 for 4-5 days, or via isolation of Pmel-1 Ly5.1 murine whole splenocytes followed by stimulation in vitro with 1 μM hgp10025–33 peptide and expansion in culture medium containing IL-2 for 4-5 days. For analysis of T cell effector function, these cells were then stimulated on day 4 or 5 of culture in the indicated conditions for 5 hours with anti-CD3 and CD28 without IL-2 in the presence of brefeldin-A and monesin (BD Biosciences). For assaying co-inhibitory signalling, PD-L1 based co-inhibition PD-L1-IgG2a (R&D) was conjugated along with anti-CD3 and anti-CD28 antibodies (eBioscience) and control IgG2a (R&D) onto M-450 Epoxy Dynabeads (ThermoFisher) at a ratio of (1 : 1 : 2 : 6) for (anti-CD3 : anti-CD28 : PD-L1-IgG2a : IgG2a) for a total of 5 µg mL-1 protein per 2 x 10⁶ beads overnight at 4°C. For comparative control conditions IgG2a was replaced for PD-L1 to control for bead loading. These beads were then incubated with effector CD8+ T cells at a ratio of 1:1 in the indicated conditions for 5 hours. For CTLA-4 based co-inhibition, anti-CD3, anti-CD28, and CTLA-4-IgG2a (R&D) or IgG2a (R&D) were coated onto tissue culture treated 96-well plates at a concentration of 5 µg mL-1 (in a fashion similar to standard immobilized antibody based stimulation) for each reagent overnight at 4°C. For assaying neoantigen specific reactivity, human TIL from NCI-14-C-0062, generated as described in section below, were re-activated for 5 hours with autologous pre-activated B-cells that were pulsed with the indicated wild-type or neo-antigen peptides as described below. Transduced human peripheral blood lymphocytes were co-cultured with the A375 patient derived melanoma tumour line, HLA-A*0201+ and positive for NY-ESO-1 expression33, at a ratio of 1 T cell to 3 tumour cells in the presence of brefeldin-A and monesin (BD Biosciences) for 5 hours. For analysis of human CD8+ TIL of varied histologies in the presence or absence of elevated K+ or Ba2+, TILs were first grown from tumour fragments cultured in 6000 IU mL-1 IL-2 in 1 to 1 mixture of RPMI 1640 and AIM-V, supplemented with 5% in-house human serum, penicillin and 100 µg mL-1streptomycin, 2 mM L-glutamine, 10 µg mL-1 gentamicin), antibody (Miltenyi Biotec) for approximately 14 days per standard operating GMP protocols practiced by the Surgery Branch34. These T cells were then subjected to a rapid expansion protocol (REP) using irradiated PBMC at a ratio of 1 to 300 in in the same complete media with 30 ng mL-1 OKT3 in preparation for subsequent patient transfer, these cells were activated via immobilized anti-CD3 and anti-CD28 in the presence of K+, Ba2+, and/ or OA as indicated. For experiments interrogating mouse CD4+ cells naïve were obtained by isolating splenocytes from 6-10 week old OT-II Rag-/- mice and subjected to negative selection of naïve CD4+ T cells (Stemcell Technolgies). These naïve cells were activated with immobilized anti-CD3 and anti-CD28 (5 μg mL−1 each) in media for 2 days followed by an additional 2 days on blank plates with relevant polarizing cytokines present during the entire duration of the 4 day culture: Th1 conditions (IL-12 10 ng mL-1 or as indicated, R&D Systems) Th17 conditions (IL-6 (20 ng mL−1, R&D Systems), human TGF-β1 (1 ng mL−1, R&D Systems), anti-IFN-γ neutralizing antibodies (10 μg mL−1), IL-1β (10 ng mL-1), or iTreg conditions (human TGF-β1 200 pg mL−1) as indicated.
For selected experiments as indicated cells were treated with Okadaic Acid (OA) at a concentration of 200 nM (mouse CD8+ T cells) and 125 nM (human CD8+ TIL), Gramicidin (0.75 or 1.5µM), Ouabain 125µM (pre-incubated for 30 min), 1-EBIO (50µM), or Valinomycin (2µM).
RNA purification, quantitative real-time RT-PCR, RNA-sequencing and bioinformatic analysis
RNA sequencing was performed and analysed as described previously35. CD8+62L+ C57BL/6 splenocytes were FACS sorted from 6-8 week old mice in biological triplicate and activated with anti-CD3 and CD28 for 48 hours in IL-2 100 IU mL-1 and cultured in RPMI complete media for an additional 72 hours. Cells were then subjected to ficoll density separation to isolate live cells, placed in complete media without IL-2 in the presence or absence of elevated [K+]e, and either re-stimulated with anti-CD3 and CD28 or kept in complete media for two hours with no stimulation (No stim). Cellular RNA was preserved with RNAlater (Qiagen) and purified with the RNeasy Plus Mini Kit (Qiagen, Valencia, CA). RNA was subsequently used to prepare RNA-seq libraries by using TruSeq SRRNA sample prep kit (FC-122-1001, Illumina) according to the manufacturer’s instructions. The libraries were sequenced for 150bp (paired-end) using a NextSeq500 sequencer (Illumina). Sequence reads from each cDNA library were mapped onto the mouse genome build mm9 by using Tophat, and the mapped data was then processed by Cufflinks36. The obtained data was normalized based on RPKM (reads per kilobase exon model per million mapped reads). To define differentially regulated genes, we used a 1.5-fold change difference between treatment groups. Real-time RT-PCR was performed for genes following cDNA generation by reverse transcription (Applied Biosystems) with primers from Applied Biosystems by Prism 7900HT (Applied Biosystems). RNA-sequencing raw data files are deposited at GEO-GSE84996.
Extracellular Acidification Rate and Basal Oxygen Consumption Rate
OCR and ECAR were measured following re-stimulation of T cells using anti-CD3/28 Dynabeads (Invitrogen) in a 0.8:1 ratio at 37°C using an XF24 extracellular analyzer (Seahorse Bioscience) as previously described37 in the indicated conditions. Oxygen consumption rates (OCR) and extracellular acidification rates (ECAR) were measured in XF media (nonbuffered RPMI 1640 containing 25 mM glucose, 2 mM L-glutamine, and 1 mM sodium pyruvate) in a 1:1 mixture with tonicity controlled additive free standard RPMI 1640 with normal or elevated [K+] under basal conditions and in response to 1 μM oligomycin, 2 μM fluoro-carbonyl cyanide phenylhydrazone (FCCP), or 100 nM rotenone with 1 μM antimycin A (Sigma).
Intracellular Cytokine Staining, PhosFlow, and flow cytometry
Suspensions containing T cells were stained with fixable live/dead (Invitrogen) in PBS followed by surface antibody staining in FACS buffer (PBS with 0.5% BSA and sodium azide). For intracellular cytokine staining, cells were stained for intracellular molecules following fixation and permeabilization. For phosphostaining BD PhosFlow reagents were utilized and fixation/permeabilization protocols were carried according the to manufacturer’s protocol. After washing, cells were stained with antibody-fluorochrome conjugates for the indicated phosphorylated proteins (pZap70Y319 (BD Biosciences), all other phospho-antibodies were purchased from Cell Signaling). Antibodies for surface staining and intracellular cytokine staining were purchased from BD Biosciences and eBiosciences. For determination of cytoplasmic membrane potential (Vm) cells were incubated in 2uM DiSBAC43 (Invitrogen) in conditions as indicated for 60 minutes prior to evaluation. For determination of [K+]i, cells were loaded with the potassium sensitive dye Asante Green-4 (TEFLabs) with PowerLoad (Invitrogen) per the manufacturer’s protocols. All experiments were conducted on a BD Fortessa flow cytometer (Becton Dickinson) and analyzed with FlowJo software.
Identification and purification of mutation specific tumour infiltrating lymphocytes (TIL)
Cancer specific mutations and TIL targeted against those mutations from patients with metastatic melanoma were identified as previously described38. Briefly, patients were enrolled on a clinical protocol (NCI-14-C-0062). Whole-exomic sequencing (WES) was performed on tumour tissue and normal peripheral blood cells by Personal Genome Diagnostics (PGDx, Baltimore, MD) and the data was aligned to genome build hg18. A viable metastatic tumour deposit was selected for resection as a source for TIL. The resected en-bloc tumour was subjected to mechanical disruption via the GenlteMACS Dissociator. The bulk tumour digest was cultured in complete media without IL-2 or other cytokines overnight. The following day CD3+PD-1+ T cells were FACS sorted using a BD Jazz Flow cytometer. These sorted T cells were then subjected to a rapid expansion protocol (REP) using irradiated PBMC at a ratio of 1 to 300 in 50/50 medium (1 to 1 mixture of RPMI 1640 and AIM-V, supplemented with 5% in-house human serum, 100 U mL-1penicillin and 100 µg mL-1streptomycin, 2 mM L-glutamine, 10 µg mL-1gentamicin), 3000 IU mL-1of IL-2, and 30 ng mL-1of OKT3 antibody (Miltenyi Biotec) for approximately 14 days. At the conclusion of the first REP T cells were screened and FACS sort enriched with the BD Jazz sorter based on 41BB positivity38, against tandem mini-gene (TMG) constructs encoding for tumour specific mutations identified by WES for each patient and tumour, as described above and previously9,38,39. These enriched neo-antigen specific T cells were then expanded via a second REP. At the conclusion of the second REP T cells were activated with peptide pulsed (at 1 : 3; effector : target) autologous CD40L stimulated B-cells with either 10 µg mL-1 of the full length 23-mer mutated or wild peptide (Patient A) or 1 µg mL-1 of the minimal epitope (Patient B,C) in the indicated conditions.
Retroviral transduction
Platinum-E ecotropic packaging cells (Cell Biolabs) were plated one day prior to transfections on poly-D-lysine coated 10cm plates (Corning) at a concentration of 6x10⁶ cells per plate. Packaging cells were transfected with 20µg of retroviral plasmid DNA encoding MSGV-Thy1.1, MSGV-Kcna3-Thy1.1, MSGV-Kcna3-Thy1.1 (W389F) (referred to as Kcna3_PD) 25, 40, MSGV-Ppp2r1a(K416E) -Thy1.1 (referred to as PP2A_DN41,42), MSCV-IRES-Thy1.1 (pMIT), or pMIT Akt1-CA43 where indicated along with 6µg pCL-Eco plasmid DNA using 60µL Lipofectamine 2000 in OptiMEM (Invitrogen) for 8 hours in antibiotic-free media. Media was replaced 8h after transfection and cells were incubated for a further 48 hours. Retroviral supernatants were then collected and spun at 2000g for 2 h at 32°C onto 24 well non-tissue culture treated plates coated overnight in Retronectin (Takara Bio). For in vivo experiments live cells were isolated via ficoll density separation (Cedarlane) and subjected to positive-selection via CD90.1-microbead column enrichment according to the manufacturer’s protocol (Miltenyi) prior to transfer, yielding a CD8+ T cell population 70-95% Thy1.1+ prior to transfer. For retroviral transduction of human PBL with the NY-ESO-1 TCR, patients with metastatic melanoma on the clinical protocol NCI-13-C-0214 were subjected to leukopheresis and their PBL were transduced with a MSGV1 backbone encoding the NY-ESO-1 murine derived TCR as previously described17. After primary transduction and culture (10 days), these cells were then further expanded via a REP as described above (days 10-23) and subsequently assayed for target-specific effector function in the indicated conditions.
Adoptive cell transfer (ACT) and tumour immunotherapy
For immunotherapy, C57BL/6 were implanted with subcutaneous B16 melanoma (5 × 10⁵ cells). At the time of ACT, 10 days after tumour implantation, mice (n ≥ 5 for all groups) were sub-lethally irradiated (600 cGy), randomized, and injected intravenously with 5x10 5 Pmel-1 Ly5.1 cells transduced with control or Kcna3 expressing retrovirus, and received intraperitoneal injections of IL-2 in PBS (6 × 10⁴ IU/0.5 ml) once daily for 3 days starting on the day of cell transfer. Tumours were blindly measured using digital callipers. Tumour size was measured in a blinded fashion approximately every two days after transfer and tumour area was calculated as length x width of the tumour. Mice with tumours greater than 400mm2 were euthanized. The products of the perpendicular tumour diameters are presented as mean ± SEM at the indicated times after ACT. For functional analysis of transferred Pmel-1cells, B16 tumour-bearing mice received Pmel-1 cells as above, and six to eight days following cell transfer mice were injected with 500 uL of 0.5 mg mL-1 brefeldin-A (Sigma) and six hours later tumours were harvested and processed for live/dead, surface, fixation, and intracellular staining for direct in vivo IFN-γ capture44. For ex vivo restimulation, tumours were harvested, processed as above, red cells were lysed with ACK lysis buffer for 2 min at room temperature, then cell suspensions were subjected to live-cell isolation via ficoll density gradient separation (CedarLane) and stimulated in media containing Leukocyte activation cocktail with Golgiplug (BD biosciences) for 4 h at a final concentration of 2 µL mL-1.
Viral infection and kinetic analysis
For assessing the response of CD8+ T cells to acute viral infection, 5 × 10⁵ transduced and Thy1.1+ enriched Pmel-1 Ly5.1 CD8+ T cells were transferred into recipient Thy1.2 Ly5.2 C57BL/6 mice. Immediately following transfer, mice were infected with rhgp100 1 × 10⁷ plaque-forming units (PFU). At the indicated time points following transfer recipient mouse blood was obtained via sub-mandibular venipuncture and analysis for phenotype and enumeration of the congenically identified transferred cells.
TCR crosslinking, western blots
As described previously45, to induce TCR crosslinking in vitro generated T cells were rested overnight in the absence of IL-2, subjected to live cell isolation via ficoll density gradient separation, pre-incubated with soluble anti-CD3 and anti-CD28-biotin, appropriate surface antibodies, and pharmacologic inhibitors where indicated in additive free RPMI 1640 at 4°C. Cells were then washed, brought to 37°C, and stimulated via the addition of streptavidin in the indicated conditions. For western blots, at the indicated time points following cross-linking cells were lysed by the addition of 95°C 2x Laemmli sample buffer with 2-mercaptoethanol (Bio-Rad Laboratories) and sonicated for 40 seconds at 10% intensity prior to gel loading. For Kv1.3 protein analysis, Thy1.1+ enriched T cells were lysed in 1xRIPA buffer (Thermofischer) with protease and phosphatase inhibitors (Roche). Western blotting was performed using TGX reagents (Bio-Rad Laboratories) and protocols on PVDF paper. Following transfer blots were blocked with 5% BSA then incubated with antibodies against phospho-Tyrosine (4G10; EMD Millipore), pAkt-T308, Total Akt, β-actin, Akt-substrate, or phospho-Threonine with appropriate HRP-conjugated or Alexa 647-conjugated secondary antibodies (Cell Signaling Technology), anti-Kv1.3 (NeuroMab). For HRP-conjugated secondary antibodies blots were developed using chemiluminescence (Thermo Fisher Scientific), gel images were captured with the Gel Doc XRS (Bio-Rad Laboratories). For PI3K activity, cells were fixed at the indicated time points by the 1:1 addition of a mixed lysis solution containing 30 mM HCl, 65% methanol, and 30% chloroform, maintained at -80°C then processed and analysed as previously described46.
TCR induced Calcium Influx
T cells were isolated and primed as above. Prior to analysis cells were ‘rested’ in IL-2 free complete RPMI 1640 for at least 8 hours. Cells were loaded with 1 μM Fluo3-AM and 1 μM Fura Red-AM (Invitrogen) for 30 min at 37°C in HBSS with Ca2+ and Mg2+ and 2% FCS, washed twice and then resuspended in HBSS with anti-CD3 and CD28-biotin conjugates (eBioscience) and live/dead (Invitrogen). For flow cytometry analysis, samples were resuspended in pre-warmed 37°C 1:1 mixtures of HBSS and isotonic normokalemic or hyperkalemic additive free RPMI (as described above in External Solution Formulations), a baseline measurement was recorded for 20 seconds, followed by the addition of Streptavidin (Invitrogen) to a final concentration of 20 µg mL-1 to induce TCR cross-linking and Ca2+ influx. Kinetic analyses were performed with the FlowJo software package (TreeStar).
shRNA mediated Ppp2r2d knockdown
A pLKO-Thy1.1 construct targeting Ppp2r2d was a generous gift of Dr.’s Zhou and Wucherpfenning and lentiviral particles were generated per their protocol4. BM cells were collected from the femurs and tibiae of 6-8 week old donor mice. After red blood cell lysis, hematopoietic stem and progenitor cells were enriched by autoMACS depletion of lineage positive cells using the Lineage Cell Depletion Kit (Miltenyi) for BM cells. Negatively selected cells were cultured in chemically defined serum free medium X-vivo 10 with Gentamicin (Lonza) supplemented with L-glutamine (1x) (Gibco), beta-mercaptoethanol (50mM), mouse recombinant SCF (50 ng mL-1), IL-6 (10 ng mL-1), IL-3 (5ng mL-1), FLT-3L (5ng mL-1) and IL- 7 (5ng mL-1) (Peprotech). The following day, these lineage depleted BM cells were transduced by spin-infection at 32°C degrees 2000RPM for 90 minutes in the presence of lentiviral supernatant and 5 µg mL-1polybrene (Sigma-Aldrich). Cells were incubated for another 2-4 hours prior to tail vein injection into Rag2-/- lethally irradiated (1000 cGy) recipient mice at 1-2 x 10⁶ cells per mouse in 500 uL sterile PBS. CD8+Thy1.1+CD44+CD62L+ cells were FACS sorted 6-8 weeks following adoptive transfer, activated, and assayed as above.
PP2A Phosphatase Assay
PP2A activity was evaluated after immunoprecipitation utilizing a malachite green phosphatase assay kit as per the manufacturer’s instructions (EMD Millipore).
Extended Data
Extended Data 1. Extracellular K+ release from apoptotic and necrotic cells inhibits T cell effector function.
(a) Potassium concentration in TIF, RPMI, and mouse serum (b) Ratio of indicated ions in normal human tissue in comparison to serum measured on the day of tissue collection in cancer patients undergoing resection of nearby cancers originating from the same tissue type. (c) Representative flow cytometry plots of B16 melanoma tumour cells following the indicated treatment. (d) Extracellular [K+] quantification following the indicated treatment. (e,f) Representative flow cytometry plots following anti-CD3/28 stimulated CD8+ T cells cultured in isotonic or hypertonic to RPMI in the indicated conditions (g) quantification of (f). (h) Quantification of cytokine production by CD8+T cells following stimulation in the indicated conditions, elevated Ca2+ and Mg2+ conditions equal to 2mM, in comparison to 0.4 mM for control conditions. (i) Cytokine production by T cells across a titration of anti-CD3 in the indicated conditions. (j) Representative flow cytometry plots and quantification following anti-CD3/CD28 titration based activation of CD8+ T cells in the indicated conditions. Error bars represent mean ± SEM. *P < 0.05; **P< 0.01 ***P < 0.001; ****P < 0.0001 between selected relevant comparisons, 2-tailed Student’s t tests (a-d,h), 2-way ANOVA (g,i,j). (a) at least three biological replicates (b) five biological replicates (c,d) four experimental replicates (e-j) three culture replicates per condition. (c-j) Representative of at least two independent experiments.
Extended Data 2. Potassium induced T cell suppression is functionally non-redundant to CTLA-4 and PD-L1 co-inhibitory signals and is present in TIL neoantigen responses.
(a-b) IFN-γ+ of CD8+ in the indicated conditions. (c) Flow cytometry analysis of cytokine production by CD4+ T cells polarized to under (c) TH1 or (d) TH17 conditions and subsequently re-activated via immobilized anti-CD3/28 in the indicated experimental conditions. (e) Annexin V and Propidium Iodide (PI) staining following activation of primed CD8+ T cells in the indicated conditions. (f) Representative flow cytometry plots and quantification of human neo-antigen selected TIL from 3 patients stimulated in the indicated conditions with cognate mutated (mut) neo-antigen peptide pulsed target cells (autologous B-cells). (g) Relevant somatic mutation induced neoepitope for Pts. A-C in (f). (h) Representative flow cytometry and quantification of peripheral blood leukocytes from 3 patients transduced with an HLA*A201 restricted NY-ESO-1 TCR were assayed in the indicated conditions for IFN-γ production. Additional [K+]e equal to 40 mM for (a-e) 50mM for (f,h), three culture replicates per patient per data point, representative of two independent experiments. Error bars represent mean ± SEM. *P < 0.05; **P< 0.01 ***P < 0.001; ****P < 0.0001, 2-tailed Student’s t tests (a-h). (a-h) At least three culture replicates per data point and representative of at least two independent experiments.
Extended Data 3. Elevated [K+]e acts independently of TCR induced tyrosine phosphorylation and Ca2+ to suppress serine/threonine phosphorylation within the Akt-mTOR axis.
(a) Flow cytometry analysis TCR induced Ca2+ influx in the indicated conditions (AUC = area under the curve). (b) Flow cytometry analysis of TCR induced phosphorylation of the indicated phospho-residues in primed CD8+ T cells. (c) Immunoblot analysis of phospho-tyrosine (4G10) residues from primed CD8+ T cells stimulated as above. For immunoblot source data see Supplementary Figure 1. (d) Flow cytometry analysis of CD8+ T Cells stimulated via TCR-crosslinking for the indicated phospho-residues and representative histograms at early time points. Filled grey histograms represent unstimulated cells. (e) Flow cytometry analysis of the indicated phospho-proteins in CD8+ T cells stimulated at later time points following immobilized anti-CD3 and anti-CD28 stimulation in the indicated conditions. Elevated [K+]e equal to 40mM, isotonic. Error bars represent mean ± SEM. *P < 0.05; **P< 0.01 ***P < 0.001; ****P < 0.0001 between selected relevant comparisons, 2-tailed Student’s t tests (a,b), 2-way ANOVA (d,e). (a) Three biologic replicates per condition (b,d,e) three technical replicates per data point. Representative of (a-d) three or (e) two independent experiments.
Extended Data 4. Elevated [K+]e suppression of TCR induced Akt-mTOR signalling limits activation induced nutrient consumption and T cell effector lineage commitment.
(a-b) Flow cytometry analysis of the indicated phospho-proteins in CD8+ T Cells stimulated via anti-CD3 and anti-CD28 cross-linking in the indicated conditions. (c) 2-NBDG uptake in primed CD8+ T cells induced by TCR stimulation in the indicated conditions with representative histograms and quantification. (d) Seahorse XF Bioflux analysis of CD3-28 Dynabead induced extracellular acidification (ECAR) and oxygen consumption rate (OCR) of CD8+ T cells in the indicated conditions (e) Flow cytometry analysis of CD4+ T cells polarized in the indicated experimental condition concurrently with (e) TH1, (f) TH17, or (g) iTreg cytokines. Elevated [K+]e equal to 40mM. Error bars represent mean ± SEM. *P < 0.05; **P< 0.01 ***P < 0.001; ****P < 0.0001 between selected relevant comparisons, 2-way ANOVA (a,b), 2-tailed Student’s t tests (c-g).Three technical or (c-g) culture replicates per data point. (a-g) Representative of two independent experiments.
Extended Data 5. Pharmacologic inhibition and genetic disruption of PP2A function restores T cell effector function in elevated [K+]e.
(a) Flow cytometry analysis of the indicated phospho-proteins in primed CD8+ T cells stimulated via TCR-crosslinking in the indicated conditions. (b-c) Flow cytometry analysis of CD8+ T cell IFN-γ production following immobilized anti-CD3/28 and induced stimulation in the indicated conditions (b), or among cells expressing a PP2A_DN isoform (c). (d) Ppp2r2d gene expression in the indicated populations followed by flow cytometry analysis of IFN-γ production of the same. (e) Flow cytometry analysis of IFN-γ production by CD8+ T cells expressing an Akt1-CA isoform stimulated in the indicated conditions. Error bars represent mean ± SEM. *P < 0.05; **P< 0.01 ***P < 0.001; ****P < 0.0001 between selected relevant comparisons 2-way ANOVA (a), 2-tailed Student’s t tests (b-e) where noted (a-e) additional [K+]e equal to 40mM, (a-e) three culture replicates per condition, (a-e) representative of at least two independent experiments.
Extended Data 6. Depletion of intracellular potassium restores T cell cytokine production in the presence of elevated extracellular [K+].
(a,b) Intracellular [K+] of CD8+ T cells in the indicated conditions assayed via relative fluorescence of the potassium sensitive dye Asante-Green 4. (c) Flow cytometry analysis of IFN-γ production by primed CD8+ T cells following immobilized anti-CD3/28 based activation in the indicated conditions. (d) Plasma membrane potential (Vm) of CD8+ T cells in the indicated conditions assayed with the voltage-sensitive fluorescent indicator DiSBAC4 (e) Relative intracellular [K+] of CD8+ T cells in the indicated conditions assayed with the potassium sensitive dye Asante-Green 4. (f) Pictorial representation of the resultant intracellular changes in plasma membrane potential (Vm) and intracellular potassium concentration ([K+]i) in the presence of the ionophore Valinomycin. (g) Flow cytometry analysis of CD8+ T cells following immobilized anti-CD3/28 based re-activated in the indicated conditions. (h) Plasma membrane potential (Vm) of CD8+ T cells in the indicated conditions assayed with the voltage-sensitive fluorescent indicator DiSBAC4(3) (i) Relative intracellular [K+] of CD8+ T cells in the indicated conditions assayed with the potassium sensitive dye Asante-Green 4. (j) Pictorial representation of the resultant intracellular changes in plasma membrane potential (Vm) and intracellular potassium concentration ([K+]i) in the presence of the Na+, K+ ATPase inhibitor Ouabain. (k) Flow cytometry analysis of CD8+ T cells following immobilized anti-CD3/28 based re-activated in the indicated conditions. Error bars represent mean ± SEM. *P < 0.05; **P< 0.01 ***P < 0.001; ****P < 0.0001 between selected relevant comparisons 2-tailed Student’s t tests (c,g,k). Three technical (a,b,d,e,h,i) or culture (c,g,k) replicates per data point. (a-k) Representative of at least two independent experiments.
Extended Data 7. Elevated [K+]e does not indelibly affect T cell intracellular [K+], membrane potential (Vm), or subsequent response to potassium induced suppression of effector function.
(a) Flow cytometry based calibration for intracellular [K+]. For all values cells were treated with 50 µM Gramicidin in titrated doses of extracellular [K+] to provide a known intracellular [K+]. (b) Intra-experimental quantification of intracellular [K+] in control conditions and elevated extracellular [K+] as defined by calibration from (a). (c) Flow cytometry analysis of the relative plasma membrane potential (Vm) of CD8+ T cells of the indicated origin using the voltage-sensitive fluorescent indicator DiSBAC4(3) (d) cells of the indicated origin assayed in the indicated conditions as in (c). (e) Flow cytometry analysis of relative intracellular [K+] of CD8+ T cells of the noted origin washed and assayed as indicated conditions quantified by relative fluorescence of the potassium sensitive dye Asante-Green 4. (f) Compiled analysis of relative IFN-γ production by CD8+ of the indicated origin washed and subjected to TCR stimulation in the indicated conditions. Error bars represent mean ± SEM. NS, not significant, between experimental and the control condition as assayed by 2-tailed Students t test (c) or 2-way ANOVA (d-f), for chronic conditioning additional [K+]e equal to 40mM, three (a-e) technical or (f) culture replicates per condition, (a-f) representative of two independent experiments.
Extended Data 8. Enforced Kcna3 or Kcnn4 expression in CD8+ T cells augments effector function.
(a) Flow cytometry analysis of CD8+ T cells retrovirally engineered with Ctrl-Thy1.1 or Kcna3-Thy1.1 encoding constructs assayed for relative intracellular [K+] quantified by relative fluorescence of the potassium sensitive dye Asante-Green 4. (b) Flow cytometry analysis of CD8+ T cells following re-activated in the indicated conditions. (c) Flow cytometry analysis of CD8+ T cells retrovirally engineering with Ctrl-Thy1.1, Kcna3-Thy1.1, or Kcnn4-Thy1.1 encoding constructs and re-activated in the indicated conditions. (d) Flow cytometry analysis of IFN-γ+ among CD8+ following re-activation in the indicated conditions (e). Flow cytometry analysis of Pmel-1 CD8+Thy1.1+ TIL IFN-γ+ production 6-8 days after transfer into tumour bearing hosts following ex vivo re-activation. (f) Pmel-1 CD8+ T cells retrovirally engineered with either Ctrl-Thy1.1 or Kcna3-Thy1.1 constructs and transferred into C57BL/6 hosts in conjunction with vv-hgp100 and quantified by cell number (f) or (g) surface phenotype found in the blood of recipients. Error bars represent mean ± SEM), 2-tailed Student’s t tests (a-d). 2-way ANOVA (f,g), NS, not significant, *P < 0.05; **P< 0.01 ***P < 0.001; ****P < 0.0001. Three (a) technical or (b-d) culture replicates per condition. (e) seven mice per group (f,g) five mice per group. (a-g) Representative of two independent experiments.
Extended Data 9. Elevated intracellular [K+] induced suppression of human CD8+ TIL effector function requires intact PP2A activity.
(a) Flow cytometry analysis of relative intracellular [K+] via the potassium sensitive fluorescent dye Asante-Green 4 of human CD8+ TIL in the indicated conditions. (b) Representative flow cytometry of the same cells in (a) following TCR based activation in the indicated conditions, quantification depicted in Fig. 4e. (c) Flow cytometry analysis of CD8+ T cells retrovirally engineered with either Ctrl-Thy1.1, Kcna3-Thy1.1, or Kcna3_PD - Thy1.1 encoding constructs. (d) Flow cytometry analysis of Thy1.1+ (transduced) Pmel-1 CD45.1+CD8+ TIL re-isolated 6 days following transfer into B16 melanoma-bearing mice and re-stimulated ex-vivo. Immunoprecipitated PP2A protein complexes isolated and assayed for relative phosphatase activity in (e) titrated concentrations of Okadaic acid or (f) the indicated conditions. Additional [K+]e equal to 40 mM for mouse cells and 50 mM for human cells unless otherwise indicated. Error bars represent mean ± SEM. NS, not significant between selected relevant comparisons, *P < 0.05; **P< 0.01 ***P < 0.001; ****P < 0.0001, 2-tailed Student’s t tests (c,f). Three (a,e,f) technical or (b,c) culture replicates per condition. (d) Five mice per group. (a-f) Representative of two independent experiments.
Extended Data 10. Intratumoural inhibition of T cell effector function via an ionic checkpoint.
(a) Healthy tissue contains limited local cellular decay, maintaining the interstitial [K+]e close to serum. T cells are robustly activated following TCR stimulation. (b) Tumour intrinsic phenomena produce a high density of cell death within cancers. Cell death leads to release of intracellular potassium into the extracellular space. The resultant elevated extracellular [K+] acts to increase the intracellular [K+] of T cells, limiting their activation and effector function. (c) Reduction of [K+]i and increased effector function can be imparted to tumour-specific T cells by over-expression of the potassium channel Kv1.3 (Kcna3).
Supplementary Material
Acknowledgements
The research was supported by the Intramural Research Programs of the NCI and NHLBI, Wellcome Trust/Royal Society grant 105663/Z/14/Z (R.R.) and UK Biotechnology and Biological Sciences Research Council grant BB/N007794/1 (R.R. and K.O.). We thank S.A. Rosenberg, K. Hanada, K.J. Swartz for valuable their valuable discussions and intellectual input, A. Mixon and S. Farid for expertise with cell sorting and G. McMullen for expertise with mouse handling.
Footnotes
Author Contributions R.E., S.V., R.R., J.H.P., C.A.K., and N.P.R. wrote the manuscript. R.E. designed all experiments and carried out all except Extended Data (ED) 1c,d and ED 9e,f. S.V. designed and carried out experiments Fig. 1h,i; Fig. 4h,i; ED 1c,d; ED 2a,b; ED 3e; ED 8d,fg; ED 9e,f. R.R. designed experiments Fig. 1a-d; Fig. 2a,b,e; Fig. 3 a,c,k; Fig 4. d,f-i; ED 1b, ED 2c,d; ED 3c,e; ED4 e-g; ED5 b,e; ED 7c-f; ED 8a,e-g; N.P.R. designed all experiments. D. C. designed experiments Fig. 3b; Fig. 4b; ED 2c,d; ED 4c-g; ED 8e-g. C.A.K. designed experiments Fig. 1b,c,j; Fig. 2,b; Fig. 3c; Fig. 4c,e,h,i; ED 2e-h; Fig. 8e-g; ED9b. J.H.P. designed experiments Fig. 3h-m; ED 2c,d; ED 7a,b; Z.Y. designed and carried out experiments Fig. 4h,i; ED 8f,g. D.P. designed experiments Fig. 2a-c; Fig. 4h,i; ED 3a,c. T.Y. edited the manuscript, provided reagents, and designed experiments Fig 1j; ED 8f,g. K.O. and V.C. provided reagents, designed, and carried out experiments Fig. 2h. A.G. provided reagents and designed experiments Fig. 1j; ED 2f-h. M.S. designed and carried out ED 4c,d. S.P. designed experiments Fig. 3a; Fig. 1h,i; ED 1c,d; ED 2a,b. G.C.G. designed experiments Fig. 2d-g; ED 2b-d and carried out ED 3c. D.S.S. and W.M.L. contributed reagents Fig. 1b; ED 1b.
The authors declare no competing financial interests.
References
- 1.Mellman I, Coukos G, Dranoff G. Cancer immunotherapy comes of age. Nature. 2011;480:480–489. doi: 10.1038/nature10673. [DOI] [PMC free article] [PubMed] [Google Scholar]
- 2.Richards CH, Mohammed Z, Qayyum T, Horgan PG, McMillan DC. The prognostic value of histological tumor necrosis in solid organ malignant disease: a systematic review. Future Oncol. 2011;7:1223–1235. doi: 10.2217/fon.11.99. [DOI] [PubMed] [Google Scholar]
- 3.Li G, et al. EphB3 suppresses non-small-cell lung cancer metastasis via a PP2A/RACK1/Akt signalling complex. Nat Commun. 2012;3:667. doi: 10.1038/ncomms1675. [DOI] [PubMed] [Google Scholar]
- 4.Zhou P, et al. In vivo discovery of immunotherapy targets in the tumour microenvironment. Nature. 2014;506:52–57. doi: 10.1038/nature12988. [DOI] [PMC free article] [PubMed] [Google Scholar]
- 5.Sitkovsky M, Lukashev D. Regulation of immune cells by local-tissue oxygen tension: HIF1 alpha and adenosine receptors. Nat Rev Immunol. 2005;5:712–721. doi: 10.1038/nri1685. [DOI] [PubMed] [Google Scholar]
- 6.Ho PC, et al. Phosphoenolpyruvate Is a Metabolic Checkpoint of Anti-tumor T Cell Responses. Cell. 2015;162:1217–1228. doi: 10.1016/j.cell.2015.08.012. [DOI] [PMC free article] [PubMed] [Google Scholar]
- 7.Zimmerli W, Gallin JI. Pus potassium. Inflammation. 1988;12:37–43. doi: 10.1007/BF00915890. [DOI] [PubMed] [Google Scholar]
- 8.Mirrakhimov AE, Ali AM, Khan M, Barbaryan A. Tumor Lysis Syndrome in Solid Tumors: An up to Date Review of the Literature. Rare Tumors. 2014;6:5389. doi: 10.4081/rt.2014.5389. [DOI] [PMC free article] [PubMed] [Google Scholar]
- 9.Tran E, et al. Cancer immunotherapy based on mutation-specific CD4+ T cells in a patient with epithelial cancer. Science. 2014;344:641–645. doi: 10.1126/science.1251102. [DOI] [PMC free article] [PubMed] [Google Scholar]
- 10.Feske S. ORAI1 and STIM1 deficiency in human and mice: roles of store-operated Ca2+ entry in the immune system and beyond. Immunol Rev. 2009;231:189–209. doi: 10.1111/j.1600-065X.2009.00818.x. [DOI] [PMC free article] [PubMed] [Google Scholar]
- 11.Omilusik K, et al. The Ca(v)1.4 calcium channel is a critical regulator of T cell receptor signaling and naive T cell homeostasis. Immunity. 2011;35:349–360. doi: 10.1016/j.immuni.2011.07.011. [DOI] [PubMed] [Google Scholar]
- 12.Li FY, et al. Second messenger role for Mg2+ revealed by human T-cell immunodeficiency. Nature. 2011;475:471–476. doi: 10.1038/nature10246. [DOI] [PMC free article] [PubMed] [Google Scholar]
- 13.Wu C, et al. Induction of pathogenic TH17 cells by inducible salt-sensing kinase SGK1. Nature. 2013;496:513–517. doi: 10.1038/nature11984. [DOI] [PMC free article] [PubMed] [Google Scholar]
- 14.Wiig H, Tenstad O, Iversen PO, Kalluri R, Bjerkvig R. Interstitial fluid: the overlooked component of the tumor microenvironment? Fibrogenesis Tissue Repair. 2010;3:12. doi: 10.1186/1755-1536-3-12. [DOI] [PMC free article] [PubMed] [Google Scholar]
- 15.Haslene-Hox H, et al. A new method for isolation of interstitial fluid from human solid tumors applied to proteomic analysis of ovarian carcinoma tissue. PLoS One. 2011;6:e19217. doi: 10.1371/journal.pone.0019217. [DOI] [PMC free article] [PubMed] [Google Scholar]
- 16.Le DT, et al. PD-1 Blockade in Tumors with Mismatch-Repair Deficiency. N Engl J Med. 2015;372:2509–2520. doi: 10.1056/NEJMoa1500596. [DOI] [PMC free article] [PubMed] [Google Scholar]
- 17.Robbins PF, et al. Tumor regression in patients with metastatic synovial cell sarcoma and melanoma using genetically engineered lymphocytes reactive with NY-ESO-1. J Clin Oncol. 2011;29:917–924. doi: 10.1200/JCO.2010.32.2537. [DOI] [PMC free article] [PubMed] [Google Scholar]
- 18.Goldman DE. Potential, Impedance, and Rectification in Membranes. J Gen Physiol. 1943;27:37–60. doi: 10.1085/jgp.27.1.37. [DOI] [PMC free article] [PubMed] [Google Scholar]
- 19.Hodgkin AL, Huxley AF. A quantitative description of membrane current and its application to conduction and excitation in nerve. J Physiol. 1952;117:500–544. doi: 10.1113/jphysiol.1952.sp004764. [DOI] [PMC free article] [PubMed] [Google Scholar]
- 20.Buck MD, O'Sullivan D, Pearce EL. T cell metabolism drives immunity. J Exp Med. 2015;212:1345–1360. doi: 10.1084/jem.20151159. [DOI] [PMC free article] [PubMed] [Google Scholar]
- 21.Taffs RE, Redegeld FA, Sitkovsky MV. Modulation of cytolytic T lymphocyte functions by an inhibitor of serine/threonine phosphatase, okadaic acid. Enhancement of cytolytic T lymphocyte-mediated cytotoxicity. J Immunol. 1991;147:722–728. [PubMed] [Google Scholar]
- 22.Liu QH, et al. Modulation of Kv channel expression and function by TCR and costimulatory signals during peripheral CD4(+) lymphocyte differentiation. J Exp Med. 2002;196:897–909. doi: 10.1084/jem.20020381. [DOI] [PMC free article] [PubMed] [Google Scholar]
- 23.Wulff H, et al. The voltage-gated Kv1.3 K(+) channel in effector memory T cells as new target for MS. J Clin Invest. 2003;111:1703–1713. doi: 10.1172/JCI16921. [DOI] [PMC free article] [PubMed] [Google Scholar]
- 24.Cahalan MD, Chandy KG. The functional network of ion channels in T lymphocytes. Immunol Rev. 2009;231:59–87. doi: 10.1111/j.1600-065X.2009.00816.x. [DOI] [PMC free article] [PubMed] [Google Scholar]
- 25.Cidad P, et al. Kv1.3 channels can modulate cell proliferation during phenotypic switch by an ion-flux independent mechanism. Arterioscler Thromb Vasc Biol. 2012;32:1299–1307. doi: 10.1161/ATVBAHA.111.242727. [DOI] [PubMed] [Google Scholar]
- 26.Voronkov M, Braithwaite SP, Stock JB. Phosphoprotein phosphatase 2A: a novel druggable target for Alzheimer's disease. Future Med Chem. 2011;3:821–833. doi: 10.4155/fmc.11.47. [DOI] [PMC free article] [PubMed] [Google Scholar]
- 27.Hla T, Dannenberg AJ. Sphingolipid signaling in metabolic disorders. Cell Metab. 2012;16:420–434. doi: 10.1016/j.cmet.2012.06.017. [DOI] [PMC free article] [PubMed] [Google Scholar]
- 28.Munoz-Planillo R, et al. K(+) efflux is the common trigger of NLRP3 inflammasome activation by bacterial toxins and particulate matter. Immunity. 2013;38:1142–1153. doi: 10.1016/j.immuni.2013.05.016. [DOI] [PMC free article] [PubMed] [Google Scholar]
- 29.Wolfs JL, et al. Direct inhibition of phospholipid scrambling activity in erythrocytes by potassium ions. Cell Mol Life Sci. 2009;66:314–323. doi: 10.1007/s00018-008-8566-4. [DOI] [PMC free article] [PubMed] [Google Scholar]
- 30.Reeves EP, et al. Killing activity of neutrophils is mediated through activation of proteases by K+ flux. Nature. 2002;416:291–297. doi: 10.1038/416291a. [DOI] [PubMed] [Google Scholar]
- 31.Acquavella N, et al. Type I cytokines synergize with oncogene inhibition to induce tumor growth arrest. Cancer Immunol Res. 2015;3:37–47. doi: 10.1158/2326-6066.CIR-14-0122. [DOI] [PMC free article] [PubMed] [Google Scholar]
- 32.Budak YU, Huysal K, Polat M. Use of a blood gas analyzer and a laboratory autoanalyzer in routine practice to measure electrolytes in intensive care unit patients. BMC Anesthesiol. 2012;12:17. doi: 10.1186/1471-2253-12-17. [DOI] [PMC free article] [PubMed] [Google Scholar]
- 33.Wargo JA, et al. Recognition of NY-ESO-1+ tumor cells by engineered lymphocytes is enhanced by improved vector design and epigenetic modulation of tumor antigen expression. Cancer Immunol Immunother. 2009;58:383–394. doi: 10.1007/s00262-008-0562-x. [DOI] [PMC free article] [PubMed] [Google Scholar]
- 34.Goff SL, et al. Randomized, Prospective Evaluation Comparing Intensity of Lymphodepletion Before Adoptive Transfer of Tumor-Infiltrating Lymphocytes for Patients With Metastatic Melanoma. J Clin Oncol. 2016;34:2389–2397. doi: 10.1200/JCO.2016.66.7220. [DOI] [PMC free article] [PubMed] [Google Scholar]
- 35.Vahedi G, et al. STATs shape the active enhancer landscape of T cell populations. Cell. 2012;151:981–993. doi: 10.1016/j.cell.2012.09.044. [DOI] [PMC free article] [PubMed] [Google Scholar]
- 36.Trapnell C, et al. Transcript assembly and quantification by RNA-Seq reveals unannotated transcripts and isoform switching during cell differentiation. Nat Biotechnol. 2010;28:511–515. doi: 10.1038/nbt.1621. [DOI] [PMC free article] [PubMed] [Google Scholar]
- 37.van der Windt GJ, et al. Mitochondrial respiratory capacity is a critical regulator of CD8+ T cell memory development. Immunity. 2012;36:68–78. doi: 10.1016/j.immuni.2011.12.007. [DOI] [PMC free article] [PubMed] [Google Scholar]
- 38.Tran E, et al. Immunogenicity of somatic mutations in human gastrointestinal cancers. Science. 2015;350:1387–1390. doi: 10.1126/science.aad1253. [DOI] [PMC free article] [PubMed] [Google Scholar]
- 39.Lu YC, et al. Efficient identification of mutated cancer antigens recognized by T cells associated with durable tumor regressions. Clin Cancer Res. 2014;20:3401–3410. doi: 10.1158/1078-0432.CCR-14-0433. [DOI] [PMC free article] [PubMed] [Google Scholar]
- 40.Jimenez-Perez L, et al. Molecular Determinants of Kv1.3 Potassium Channels-induced Proliferation. J Biol Chem. 2016;291:3569–3580. doi: 10.1074/jbc.M115.678995. [DOI] [PMC free article] [PubMed] [Google Scholar]
- 41.Turowski P, Favre B, Campbell KS, Lamb NJ, Hemmings BA. Modulation of the enzymatic properties of protein phosphatase 2A catalytic subunit by the recombinant 65-kDa regulatory subunit PR65alpha. Eur J Biochem. 1997;248:200–208. doi: 10.1111/j.1432-1033.1997.t01-1-00200.x. [DOI] [PubMed] [Google Scholar]
- 42.Xing Y, et al. Structure of protein phosphatase 2A core enzyme bound to tumor-inducing toxins. Cell. 2006;127:341–353. doi: 10.1016/j.cell.2006.09.025. [DOI] [PubMed] [Google Scholar]
- 43.Hand TW, et al. Differential effects of STAT5 and PI3K/AKT signaling on effector and memory CD8 T-cell survival. Proc Natl Acad Sci U S A. 2010;107:16601–16606. doi: 10.1073/pnas.1003457107. [DOI] [PMC free article] [PubMed] [Google Scholar]
- 44.Liu F, Whitton JL. Cutting edge: re-evaluating the in vivo cytokine responses of CD8+ T cells during primary and secondary viral infections. J Immunol. 2005;174:5936–5940. doi: 10.4049/jimmunol.174.10.5936. [DOI] [PubMed] [Google Scholar]
- 45.Palmer DC, et al. Cish actively silences TCR signaling in CD8+ T cells to maintain tumor tolerance. J Exp Med. 2015;212:2095–2113. doi: 10.1084/jem.20150304. [DOI] [PMC free article] [PubMed] [Google Scholar]
- 46.Clark J, et al. Quantification of PtdInsP3 molecular species in cells and tissues by mass spectrometry. Nat Methods. 2011;8:267–272. doi: 10.1038/nmeth.1564. [DOI] [PMC free article] [PubMed] [Google Scholar]
Associated Data
This section collects any data citations, data availability statements, or supplementary materials included in this article.


