Abstract
Analysis of previously published sets of DNA microarray gene expression data by singular value decomposition has uncovered underlying patterns or “characteristic modes” in their temporal profiles. These patterns contribute unequally to the structure of the expression profiles. Moreover, the essential features of a given set of expression profiles are captured using just a small number of characteristic modes. This leads to the striking conclusion that the transcriptional response of a genome is orchestrated in a few fundamental patterns of gene expression change. These patterns are both simple and robust, dominating the alterations in expression of genes throughout the genome. Moreover, the characteristic modes of gene expression change in response to environmental perturbations are similar in such distant organisms as yeast and human cells. This analysis reveals simple regularities in the seemingly complex transcriptional transitions of diverse cells to new states, and these provide insights into the operation of the underlying genetic networks.
The recent development of DNA microarray technology has enabled the genome-wide measurement of temporal changes in gene expression levels (1, 2). Analysis of the expression patterns obtained with large gene arrays has revealed the existence of groups or “clusters” of genes with similar expression patterns (3–6). Not surprisingly, gene clusters often contain genes that encode proteins required for a common function, and, hence, co-clustering has been helpful in identifying the functions of unknown gene products. However, such cluster analyses provide little insight into the relationships among groups of co-regulated genes or the behavior of biological networks as a whole.
In this paper, we report the results of subjecting several large published gene expression data sets to singular value decomposition (SVD), a standard and straight-forward analytic procedure. We show that highly complex sets of gene expression profiles can be represented by a small number of “characteristic modes” that capture the temporal patterns of gene expression change. These modes are somewhat analogous to the characteristic vibration modes of a tuned violin string. The tone produced by the vibrating string can be entirely specified by the contributions of its characteristic vibration modes. We show here that a gene expression profile, similarly, can be precisely represented by specifying the magnitude and sign of the contribution of each of its characteristic modes. This type of “spectral” analysis yields a hierarchical interpretation of the expression data and provides insights into the nature and behavior of genetic networks.
Methods
The mathematical analysis is carried out straightforwardly by using SVD (7). The gene expression data of n genes, each measured at m discrete time points, may be written as an n × m matrix, A. Following the procedures outlined in ref. 6, we have polished the data by requiring that the rows and columns have a zero mean by subtracting the mean values of the raw data and carrying out an iterative normalization procedure for the rows and columns, ending with the row normalization. The SVD theorem (7) states that the matrix A can be written as
 |
where U (an n × n matrix) and V (an m × m matrix) are orthogonal and Σ is an n × m matrix with a specific form that we will specify later. The superscript T denotes the transposed matrix.
We now outline the procedure (7) for determining U, Σ, and V that satisfies the SVD. The r non-zero eigenvalues of AAT and ATA are the same and positive, and their square roots (called the singular values), when rank-ordered, are denoted by σ1 ≥σ2 ≥ ⋯ s ≥ σr > 0. (r, the rank of the matrix A, is no larger than m − 1 because of the data polishing.) The matrix elements of Σ are all zero except for Σi,i = σi for i = 1, r. The columns of V, denoted Vi, are the eigenvectors (corresponding to these rank ordered eigenvalues) of the matrix ATA for i = 1, r. The columns of U, denoted Ui, are determined by the formula Ui = (1/σi) AVi for i = 1, r. The other columns of U and V prove to be irrelevant because of the form of Σ.
We define the vectors, Xi(t), i = 1, r, to be the first r rows of the matrix ΣVT, where the different columns in the ΣVT matrix correspond to the times at which the corresponding expression data are measured. The vectors Xi(t) are the characteristic modes associated with the matrix A. The temporal variation of any gene j can then be written exactly as a linear combination of these r characteristic modes as
 |
1 |
One can show that, for any gene, j, Σi=1r(Uj,i σi)2 = 1. The contribution of the first k modes to the temporal pattern of a gene may then be quantified by Cj(k) = Σi=1k(Uj,i σi)2, and its average over all of the genes is given by
 |
2 |
Results and Discussions
SVD analysis of the published yeast cdc15 cell-cycle (3) and sporulation (5) data sets, as well as the data set from serum-treated human fibroblasts (4), yields spread out singular values (Table 1). The first two values are significantly greater than the others for all three data sets. The smaller scale fluctuations, as well as experimental noise, are represented by the higher order modes. This allows a hierarchical representation of the contributions of the different characteristic modes. We have carried out tests of this procedure with random data sets containing the same number of rows (genes) and columns (time points) as in the experiments. Random data sets yield similar singular values because all characteristic modes contribute about equally (Table 1). Hence, the singular values obtained from randomly generated profiles do not allow a hierarchical description of the contribution of the normal modes. By contrast, if all of the genes were characterized by purely periodic expression data, say, of the form sin(ωt + φ), with the same ω but differing φ values, there would be only two contributing characteristic modes, sin(ωt) and cos(ωt). The actual gene expression data sets yield singular values of sufficiently different magnitude so that only the first few modes are required to capture the essential features of the expression data in most cases.
Table 1.
Singular values extracted from gene expression and random data sets
| cdc15, 12 points
|
cdc15, 15 points
|
spo, selected
|
spo, full
|
fibr
|
|||||
|---|---|---|---|---|---|---|---|---|---|
| Experiment | Random* | Experiment | Random* | Experiment | Random* | Experiment | Random* | Experiment | Random* |
| 15.81 | 8.65 | 14.47 | 7.66 | 15.20 | 9.61 | 49.54 | 32.29 | 14.10 | 7.40 |
| 13.10 | 8.56 | 12.37 | 7.58 | 10.53 | 9.17 | 37.40 | 32.22 | 12.49 | 7.06 |
| 8.68 | 8.17 | 10.45 | 7.44 | 7.18 | 9.01 | 29.88 | 32.01 | 5.65 | 6.94 |
| 7.34 | 8.04 | 6.80 | 7.33 | 5.67 | 8.83 | 23.43 | 31.93 | 5.47 | 6.84 |
| 5.45 | 7.97 | 6.71 | 7.20 | 5.43 | 8.73 | 22.36 | 31.67 | 5.12 | 6.78 |
| 5.00 | 7.82 | 4.52 | 7.09 | 4.67 | 8.06 | 17.97 | 31.47 | 4.65 | 6.67 |
| 4.51 | 7.57 | 4.36 | 6.97 | 4.01 | 6.52 | ||||
| 4.26 | 7.53 | 4.15 | 6.93 | 3.19 | 6.37 | ||||
| 3.66 | 7.41 | 3.89 | 6.76 | 3.03 | 6.32 | ||||
| 3.33 | 7.33 | 3.39 | 6.64 | 2.67 | 6.12 | ||||
| 3.08 | 7.14 | 3.05 | 6.49 | 2.31 | 5.85 | ||||
| 2.89 | 6.47 | 2.17 | 5.68 | ||||||
| 2.75 | 6.38 | ||||||||
| 2.57 | 6.28 | ||||||||
Random data sets contained the same number of rows and columns as the corresponding gene expression data sets. The data were generated randomly from a uniform distribution between 0 and 1 and then were polished.
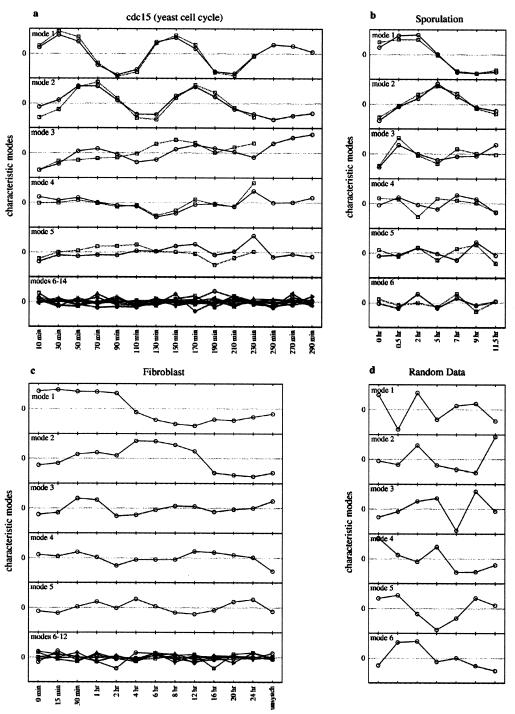
A gene expression data set with m time points has rank r = m − 1 and thus generates m − 1 characteristic modes. Each characteristic mode is the product of a normal mode and a singular value, the latter giving the characteristic mode its amplitude. The characteristic modes for the three gene expression data sets we have analyzed are shown in Fig. 1 a–c, and those for a random data set are shown in Fig. 1d. The magnitude of the singular value is reflected in the amplitude of each mode. The characteristic modes reflect the genome-wide expression pattern and are not gene-specific. The temporal pattern of variation in expression of a given gene is precisely expressed mathematically as a linear combination of the characteristic modes with gene-specific coefficients. The contribution of each mode to the final gene expression profile progressively diminishes from the lower to the higher order modes for the gene expression data sets but is approximately equal for the random data set. The structure of the two dominant modes is rather simple for all of the gene expression data sets, with 1 or 2 nodes (the modes are more complex for the cell cycle data only because they are derived from multiple cell cycles). As we demonstrate below, this means that the major features of the overall genetic response of the cells is contained in a combination of just a few different patterns.
Figure 1.
Characteristic modes (Xi(t)) for the gene expression and random data sets. (a) Yeast cell cycle data (3). The circles correspond to the 15 time-point series, and the squares in the first five panels correspond to a truncated time series with only 12 time points. The bottom panel is an overlay of modes 6–15 for the 15 time-point series only. (b) Yeast sporulation data (5). The circles correspond to modes generated from sporulation specific genes whereas the squares correspond to modes generated from genes in the complete data set (entire yeast genome). (c) Human fibroblast data (4). The format is the same as in a, except that the bottom panel is an overlay of modes 6–12. (d) Random data with the same number of genes and time points as the sporulation data.
The periodicity in the expression patterns of the roughly 800-cell cycle-regulated genes selected by Spellman et al. (3) is evident in Fig. 1a. The two dominant modes are approximately sinusoidal and are out of phase with respect to each other. As the cells enter the third cycle, they become progressively less synchronized. This asynchrony is manifested in the increasing noise in the data in the last three columns. When the last three data points are neglected, the third highest singular value declines to a magnitude comparable to those derived from the corresponding random data set (Table 1), and this results in a reduction in the contribution of the third mode to the final profile. However, the shapes of the first two dominant modes do not change significantly upon removal of the last three time points, revealing their robustness. Not surprisingly, analysis of the genome-wide data set reveals a third dominant mode that reflects monotonic changes in gene expression with respect to the reference time point. Analysis of the yeast sporulation and the human fibroblast data sets similarly reveals that two characteristic modes make a significantly greater contribution to the final profiles than the others (Table 1; Fig. 1 b and c). We have analyzed both the sporulation-up-regulated genes identified by Chu et al. (5) and the complete data set of more than 6,000 genes with similar results (Fig. 1b).
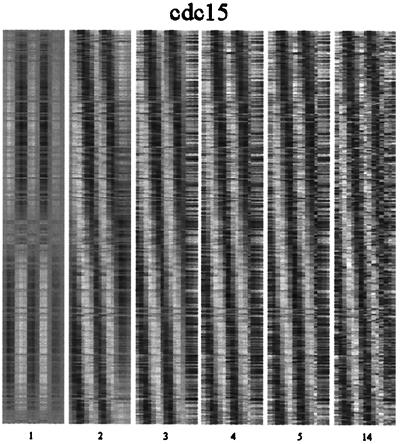
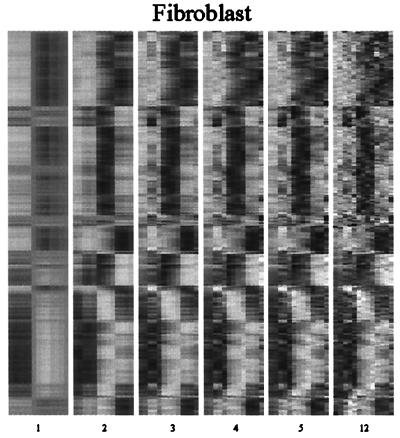
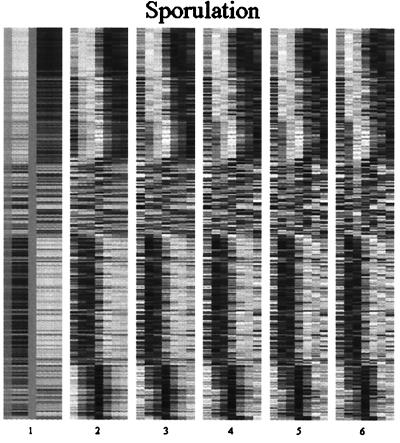
The expression profiles for the subsets of data selected by the original authors as typifying sporulation-activated, cell cycle-regulated, and serum-induced genes are reconstructed in Figs. 2–4 by using Eq. 1 and truncating the summation at k terms, with k = 1, 2, 3, 4, and 5. The sixth panel shows a reconstruction using all r terms in the summation and is identical to the original data set (3–6). It can readily be seen in the second panel of each figure that a representation comprising just the first two modes captures many of the essential features of the overall array of expression patterns. A quantitative measure of this is provided by C̄(2) (Eq. 2), which equals 0.62, 0.69, and 0.72 for the cdc15, fibroblast, and sporulation data sets respectively. The remaining modes describe minor elements in the patterns, a considerable fraction of which may be attributable to small scale (albeit possibly systematic) fluctuations and experimental noise. Although this uncovers an underlying simplicity in the genetic response patterns of cells, it does not imply that other patterns of gene expression lack significance. Several types of exceptions to the overall patterns are discussed below.
Figure 2.
A reconstruction of the expression profiles for the yeast cell cycle data set from the characteristic modes. Panels 1–5 show the results of a hierarchical reconstruction of the expression profiles using only the first 1, 2, 3, 4, and 5 characteristic modes. The last panel uses all 14 characteristic modes and exactly reproduces the original data set. Each row in each of the panels represents a different gene, and each column represents a different time point. The gray scale ranges from white (maximal expression) to black (minimal expression). The genes are ordered as in ref. 3.
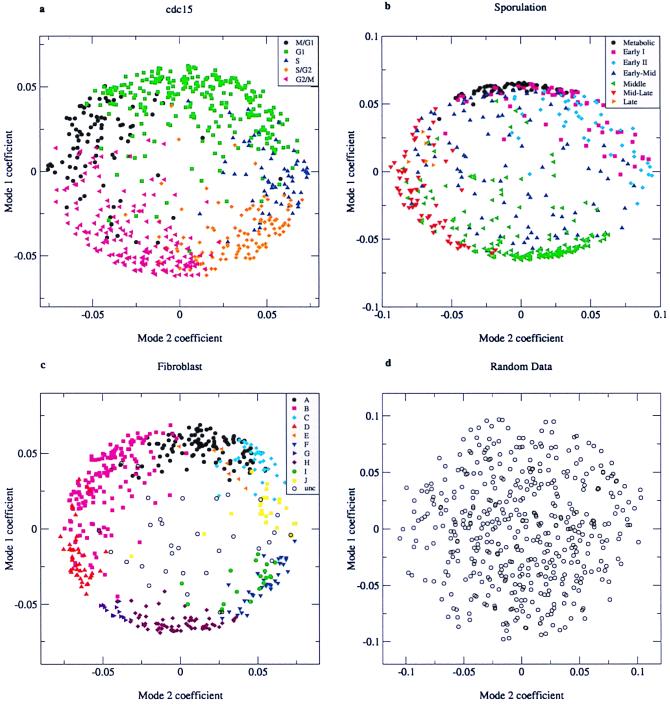
The coefficients associated with the two dominant modes are plotted against each other in Fig. 5 a–c for the three data sets represented in Figs. 2–4, respectively. The coefficients are a measure of the contribution of each mode to the structure of the expression profile of a given gene. Remarkably, the data points are fairly densely concentrated near the perimeter of a circle or an ellipse, with the interior rather sparsely populated. By contrast, when the coefficients for a random data set are plotted in the same way, they describe a filled circle (Fig. 5d). The genes corresponding to points on the perimeter are ones that are accurately represented by just the two dominant modes. Thus, the concentration of points near the perimeter of the circle or ellipse in Fig. 5 a–c simply reflects the relative importance of the first two modes.
Figure 5.
Plot of the coefficients for characteristic mode 1 against the coefficients for characteristic mode 2. Symbols of different colors and shapes are used for genes that belong to the different clusters identified by the original authors (3–5). (a) cdc15 data (first 12 time points). (b) Sporulation data (7 time points). (c) Fibroblast data (13 time points). (d) random data (7 time points).
Figure 4.
A reconstruction of the expression profiles for the human fibroblast data set from the characteristic modes. The format is the same as in Fig. 2. The last panel uses all 12 characteristic modes and exactly reproduces the original data set. The genes are ordered as in ref. 4.
Strikingly, expression profiles clustered by more conventional methods correspond well to groups of genes with similar coefficients. The correspondence is brought out in Fig. 5 by using symbols of different colors to represent the genes identified as members of a cluster by conventional clustering algorithms in previous publications (3–5). This correspondence is not surprising because SVD provides a general and objective method for identifying similarities among expression patterns. However, inspection of Fig. 5 a and b immediately reveals that previously identified clusters appear in adjacent sectors on the perimeter of the circle in the order of their temporal progression in the cell cycle and in the course of sporulation (3, 5).
How might we understand both the regularities revealed by the present analysis of gene expression data and exceptions to them? First, it follows from the dominance of the first two modes and their very simple structure that most genes undergo either just one or just two “changes of expression phase” (on to off or off to on) in the course of a single cell cycle or in the course of responding to an environmental perturbation. That is, a majority of the genes transition from active to inactive or inactive to active at most once or twice. Although there are more complex expression patterns, these are sufficiently few so that they do not dominate the system's overall response. Second, the observation for both the cell cycle and fibroblast data that the points fall near the perimeter of a circle, rather than an ellipse, means that the contributions of the two dominant modes are roughly equal. Third, the observation that the perimeter is fairly evenly populated for these two data sets (Fig. 5 a and b) implies that the coefficients vary continuously. This, in turn, implies that the expression “peaks” and “valleys” of the underlying genes change continuously in time, a conclusion that is also underscored by the diagonal light and dark columns in the representation of the yeast cell cycle gene data shown in Fig. 2, taken from ref. 3. The simple periodic structure of the dominant modes for the cell cycle data has the further implication that most of the cell cycle-regulated genes tend to be expressed for roughly the same length of time.
The uniform distribution of genes around the perimeter of the circle in Fig. 5a focuses attention on the regularity and continuity of change in gene expression around the cell cycle and has important implications for the underlying mode of transcriptional regulation. The first is that the cell cycle progression is a smooth function, with roughly equal numbers of genes being activated and inactivated per unit time and a regular succession in time of gene expression peaks. The mitotic cycle is conventionally divided into the synthesis (S) phase (bounded by gaps designated G1 and G2), in which chromosomes replicate, and mitosis (M), in which cells divide and chromosomes are segregated to daughter cells. The sequential expression of the many proteins required for these processes is orchestrated at the genetic level by changes in the activity of cyclin-dependent kinases, which are central components of the transcriptional regulation machinery. The transcription factor substrate specificity and the kinase activity are characteristic of a particular cyclin/cyclin-dependent kinase pair and can be modified additionally by phosphorylation at multiple sites, as well as interactions with other proteins (8). Transcription factor phosphorylation and dephosphorylation are probably the major, although likely not the only, molecular modifications at the heart of the cell-cycle system's integrative mechanism, permitting the collection of inputs from signal transduction wires and transmitting the integrated signal through the resultant kinase activities of the cyclin/cyclin-dependent kinases complexes. The smooth evolution of gene expression patterns in time revealed in Fig. 5 is consistent with the operation of such a subtle and continuous regulatory system.
The dense clusters of genes around maximal values of mode 1 and minimal values of mode 2 in the representation of the yeast sporulation data shown in Fig. 5b invite special attention. The ellipticity of the plot and the unequal distribution of genes along the perimeter are a direct reflection of the fact that the second singular value is significantly smaller than the first (Table 1). A consideration of the biology of sporulation provides some insights. Yeast sporulation is a simple developmental process triggered by nitrogen starvation in which the cells undergo meiosis and form cell walls. Genes encoding proteins involved in meiosis are repressed by the Ume6 transcriptional repressor, which binds the upstream repression sequence (URS1). Ume6 becomes a transcriptional activator of sporulation-specific genes upon binding of Ime1, in turn dependent on phosphorylation that is triggered by starvation (9). The dense cluster of genes at 12 o'clock on the diagram in Fig. 5b comprises what the authors refer to as “metabolic” and “early (I)” genes, a significant fraction (>30%) of which contain upstream URS1 motifs (5). This cluster is therefore likely to comprise genes induced by the activation of preexisting transcription factors. The central point is that the network is poised for a fast response by mechanisms that activate preexisting proteins through structural and conformational changes.
A second dense cluster at about 6 o'clock corresponds to the “middle” genes induced between 2 and 5 h after sporulation commences. Many of these genes are involved in meiotic division or spore morphogenesis, and a different common binding site (MSE) is detected in the upstream regions of 70% of such genes (5). The MSE sequence is recognized by the Ndt80 transcription factor (10). Hence, this dense cluster may be attributable to the activation of many genes by a single transcription factor. Indeed, if the rate-limiting step for a large group of genes is the accumulation (or activation) of a single transcription factor or transcription factor complex, such dense clusters are to be anticipated.
The coefficients of the “early-mid” group of genes in the yeast sporulation data set do not form a cluster in the representation of the data shown in Fig. 5b, nor do the data points lie near the perimeter of the ellipse, as do the coefficients of a majority of the genes. This means that characteristic modes other than the first two contribute significantly to the expression profiles of these genes. It is evident in Fig. 3 that expression patterns of this group of genes is less regular than those of the others. Curiously, little is known about the regulation of these genes (5), and it appears likely to be more complex than is the regulation of the majority of genes activated during sporulation.
Figure 3.
A reconstruction of the expression profiles for the yeast sporulation data set from the characteristic modes. The format is the same as in Fig. 2. The last panel uses all six characteristic modes and exactly reproduces the original data set. The genes are ordered as in ref. 5.
As noted earlier, SVD analysis of the human fibroblast data set (4) reveals the same kinds of regularities as did the other two data sets. Two of the singular values are significantly higher than the others but rather similar to each other. As a result, the plot of the mode 1 against the mode 2 coefficients is circular, and the points are largely near the circle's perimeter. Once again, previously identified gene clusters describe arcs on the circle's perimeter, although these were not ordered temporally by Iyer et al. (4). The coefficients for genes that were not clustered by the more conventional approach are primarily in the center of the circle, implying that modes other than 1 and 2 contribute significantly to their expression patterns. In the absence of growth factors, fibroblasts do not divide and maintain a low metabolic activity level. Addition of serum induces proliferation and expression of many wound-inducible genes (4). The results of our analysis reveal that despite the evolutionary distance between yeast and humans, the genetic responses of cells to perturbations are both simple and similar, reflecting the fact that most genes undergo just one or just two phase changes in the course of the response.
At a coarse level of resolution, the temporal ordering of gene expression for the genes involved in implementing the changes under study in each of the systems examined unfolds through the sequential addition of new transcription factors to preexisting factors, in some cases replacing them to activate new subsets of genes. At a fine level, the progressive changes in gene expression are uniform and continuous. Thus, genes are generally not activated in discrete groups or blocks, as historically implied by the division of the cell cycle into phases or the sporulation response into temporal groups. Although dense clusters of genes with a common expression profile are observed, our analytical approach brings out the continuity in the patterns of gene expression change. In the case of the yeast cell cycle, there is substantial evidence that the fine levels of regulation are mediated by cyclin-dependent kinases, whose kinase activity is modulated by interactions with other proteins and by phosphorylation and which, in turn, modulate the activity of transcription factors by phosphorylation.
In summary, we have shown that the behavior of the widely disparate gene systems analyzed here is dominated by a small subset of the characteristic modes and that a linear combination of just a few modes provides a good approximation of the behavior of the entire system in most cases. That is, the complex “music of the genes” is orchestrated through a few simple underlying patterns of gene expression change. Extending the musical analogy, it is as if the genes in a given microarray comprise a set of identically tuned strings and the characteristic modes are common to the entire set. The vibration of an individual string is represented by a linear combination of these characteristic modes. The music produced by the set of strings is then entirely specified by the contributions of each of these characteristic modes. Because just a few modes dominate and because their structure is not complex, the expression profiles of most genes are simple and typified by a small number of phase changes. The continuous variation in the gene-specific coefficients specifying the contributions of the modes reflects the continuous change in composition of the active and inactive gene subsets. More importantly, the linearized analysis inherent in SVD, combined with the dominant contributions of a small number of modes, opens the possibility of identifying causal connections among gene responses.
This work was supported by Istituto Nazionale di Fisica Nucleare (Italy), the National Aeronautics and Space Administration, an Integrative Graduate Education and Research Training grant from the National Science Foundation, Komitet Badan Naukowych Grant 2P03B-025-13, the Petroleum Research Fund administered by the American Chemical Society, and National Science Foundation Plant Genome Research Program Grant DBI-9872629.
Abbreviation
- SVD
singular value decomposition
Footnotes
Article published online before print: Proc. Natl. Acad. Sci. USA, 10.1073/pnas.150242097.
Article and publication date are at www.pnas.org/cgi/doi/10.1073/pnas.150242097
References
- 1.Pease A C, Solas D, Sullivan E J, Cronin M T, Holmes C P, Fodor S P. Proc Natl Acad Sci USA. 1994;91:5022–5026. doi: 10.1073/pnas.91.11.5022. [DOI] [PMC free article] [PubMed] [Google Scholar]
- 2.Schena M, Shalon D, Davis R W, Brown P O. Science. 1995;270:467–470. doi: 10.1126/science.270.5235.467. [DOI] [PubMed] [Google Scholar]
- 3.Spellman P T, Sherlock G, Zhang M Q, Iyer V R, Anders K, Eisen M B, Brown P O, Botstein D, Futcher B. Mol Biol Cell. 1998;9:3273–3297. doi: 10.1091/mbc.9.12.3273. [DOI] [PMC free article] [PubMed] [Google Scholar]
- 4.Iyer V R, Eisen M B, Ross D T, Schuler G, Moore T, Lee J C F, Trent J M, Staudt L M, Hudson J, Jr, Boguski M S, et al. Science. 1999;283:83–87. doi: 10.1126/science.283.5398.83. [DOI] [PubMed] [Google Scholar]
- 5.Chu S, DeRisi J, Eisen M, Mulholland J, Botstein D, Brown P O, Herskowitz I. Science. 1998;282:699–705. doi: 10.1126/science.282.5389.699. [DOI] [PubMed] [Google Scholar]
- 6.Eisen M B, Spellman P T, Brown P O, Botstein D. Proc Natl Acad Sci USA. 1998;95:14863–14868. doi: 10.1073/pnas.95.25.14863. [DOI] [PMC free article] [PubMed] [Google Scholar]
- 7.Watkins D S. Fundamentals of Matrix Computations. New York: Wiley; 1991. pp. 390–409. [Google Scholar]
- 8.Lew D J, Weinert T, Pringle J R. In: The Molecular and Cellular Biology of the Yeast Saccharomyces: Cell Cycle and Cell Biology. Pringle J R, Broach J R, Jones E W, editors. Plainview, NY: Cold Spring Harbor Lab. Press; 1997. pp. 607–695. [Google Scholar]
- 9.Rubin-Bejerano I, Mandel S, Robzyk K, Kassir Y. Mol Cell Biol. 1996;16:2518–2526. doi: 10.1128/mcb.16.5.2518. [DOI] [PMC free article] [PubMed] [Google Scholar]
- 10.Xie J, Pierce M, Gailus-Durner V, Wagner M, Winter E, Vershon A K. EMBO J. 1999;18:6448–6454. doi: 10.1093/emboj/18.22.6448. [DOI] [PMC free article] [PubMed] [Google Scholar]


