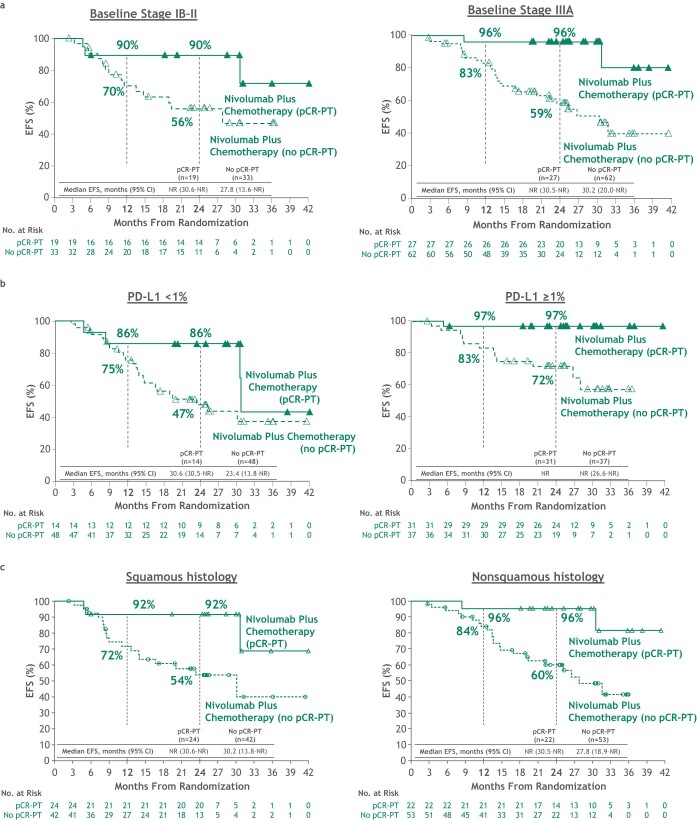
Extended Data Fig. 2. Kaplan–Meier curves of EFS by pCR status (PT) and disease characteristics in the path-evaluable patient population from the nivolumab plus chemotherapy arm.
a, Kaplan–Meier curves of EFS by pCR status (PT) and baseline disease stage. b, Kaplan–Meier curves of EFS by pCR status (PT) and baseline PD-L1 expression. c, Kaplan–Meier curves of EFS by pCR status (PT) and histology. Subgroup analyses were not performed for the chemotherapy arm because of small sample sizes. HRs were not computed because of low number of events for the pCR-PT subgroups. CI denotes confidence interval; EFS, event-free survival; HR, hazard ratio; NR, not reached; pCR, pathologic complete response; PD-L1, programmed death ligand 1; PT, primary tumor.

